Seminole vs Mexican Median Female Earnings
COMPARE
Seminole
Mexican
Median Female Earnings
Median Female Earnings Comparison
Seminole
Mexicans
$34,385
MEDIAN FEMALE EARNINGS
0.0/ 100
METRIC RATING
323rd/ 347
METRIC RANK
$33,664
MEDIAN FEMALE EARNINGS
0.0/ 100
METRIC RATING
333rd/ 347
METRIC RANK
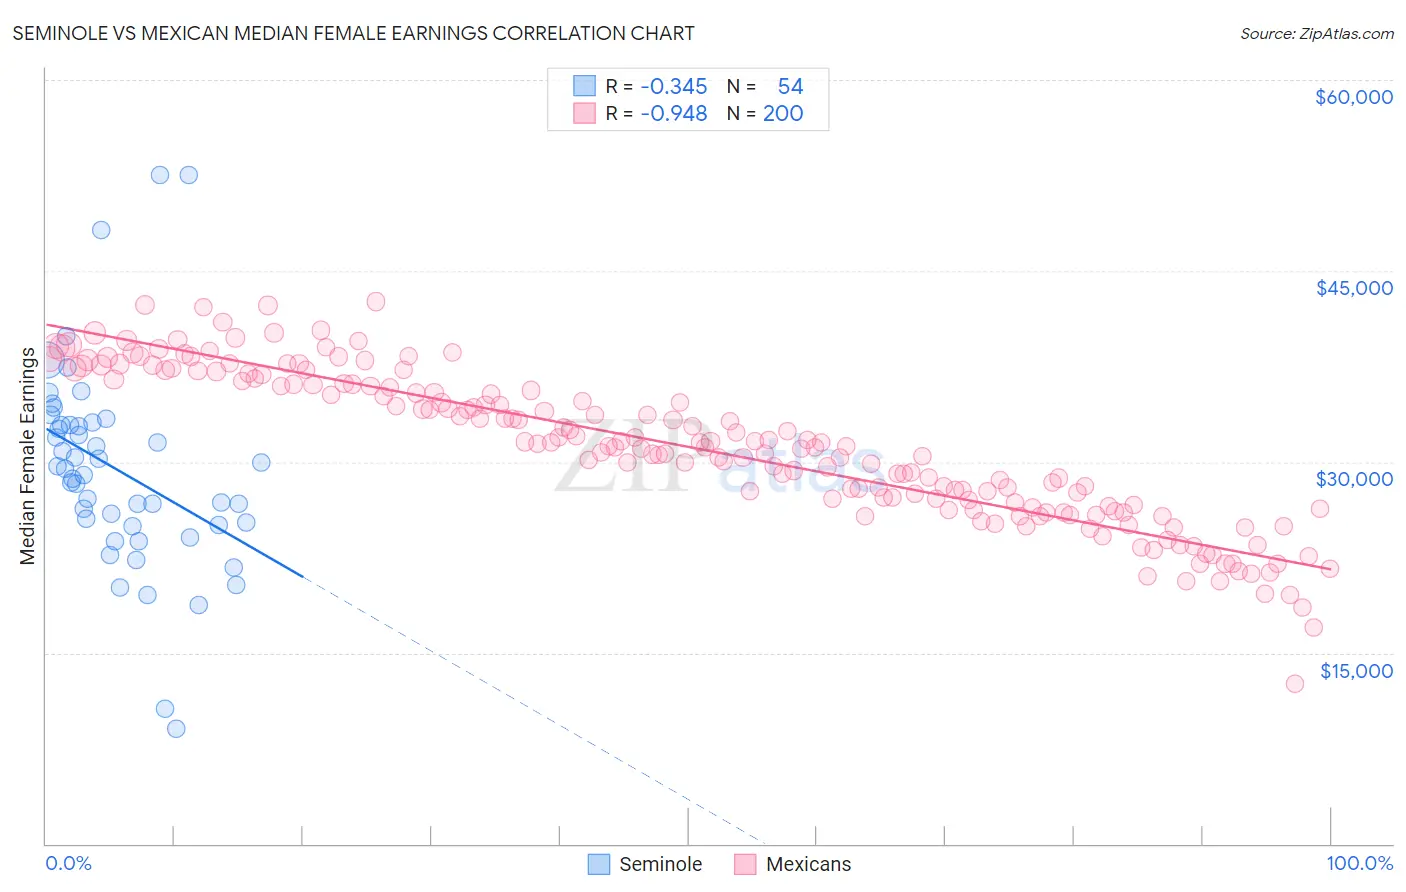
Seminole vs Mexican Median Female Earnings Correlation Chart
The statistical analysis conducted on geographies consisting of 118,266,998 people shows a mild negative correlation between the proportion of Seminole and median female earnings in the United States with a correlation coefficient (R) of -0.345 and weighted average of $34,385. Similarly, the statistical analysis conducted on geographies consisting of 563,682,270 people shows a near-perfect negative correlation between the proportion of Mexicans and median female earnings in the United States with a correlation coefficient (R) of -0.948 and weighted average of $33,664, a difference of 2.1%.
Median Female Earnings Correlation Summary
| Measurement | Seminole | Mexican |
| Minimum | $9,041 | $12,526 |
| Maximum | $52,528 | $42,584 |
| Range | $43,487 | $30,058 |
| Mean | $29,347 | $31,173 |
| Median | $29,210 | $31,351 |
| Interquartile 25% (IQ1) | $25,000 | $26,695 |
| Interquartile 75% (IQ3) | $32,861 | $36,091 |
| Interquartile Range (IQR) | $7,861 | $9,396 |
| Standard Deviation (Sample) | $8,052 | $5,874 |
| Standard Deviation (Population) | $7,977 | $5,859 |
Demographics Similar to Seminole and Mexicans by Median Female Earnings
In terms of median female earnings, the demographic groups most similar to Seminole are Chickasaw ($34,414, a difference of 0.080%), Hispanic or Latino ($34,421, a difference of 0.11%), Immigrants from Congo ($34,317, a difference of 0.20%), Immigrants from Honduras ($34,647, a difference of 0.76%), and Dutch West Indian ($34,106, a difference of 0.82%). Similarly, the demographic groups most similar to Mexicans are Spanish American Indian ($33,625, a difference of 0.12%), Choctaw ($33,775, a difference of 0.33%), Native/Alaskan ($33,806, a difference of 0.42%), Creek ($33,437, a difference of 0.68%), and Menominee ($33,894, a difference of 0.69%).
| Demographics | Rating | Rank | Median Female Earnings |
| Immigrants | Yemen | 0.0 /100 | #318 | Tragic $34,693 |
| Shoshone | 0.0 /100 | #319 | Tragic $34,677 |
| Immigrants | Honduras | 0.0 /100 | #320 | Tragic $34,647 |
| Hispanics or Latinos | 0.0 /100 | #321 | Tragic $34,421 |
| Chickasaw | 0.0 /100 | #322 | Tragic $34,414 |
| Seminole | 0.0 /100 | #323 | Tragic $34,385 |
| Immigrants | Congo | 0.0 /100 | #324 | Tragic $34,317 |
| Dutch West Indians | 0.0 /100 | #325 | Tragic $34,106 |
| Kiowa | 0.0 /100 | #326 | Tragic $34,074 |
| Cajuns | 0.0 /100 | #327 | Tragic $34,034 |
| Immigrants | Central America | 0.0 /100 | #328 | Tragic $33,953 |
| Hopi | 0.0 /100 | #329 | Tragic $33,932 |
| Menominee | 0.0 /100 | #330 | Tragic $33,894 |
| Natives/Alaskans | 0.0 /100 | #331 | Tragic $33,806 |
| Choctaw | 0.0 /100 | #332 | Tragic $33,775 |
| Mexicans | 0.0 /100 | #333 | Tragic $33,664 |
| Spanish American Indians | 0.0 /100 | #334 | Tragic $33,625 |
| Creek | 0.0 /100 | #335 | Tragic $33,437 |
| Ottawa | 0.0 /100 | #336 | Tragic $33,378 |
| Yakama | 0.0 /100 | #337 | Tragic $33,354 |
| Immigrants | Cuba | 0.0 /100 | #338 | Tragic $33,291 |