Seminole vs Taiwanese Median Female Earnings
COMPARE
Seminole
Taiwanese
Median Female Earnings
Median Female Earnings Comparison
Seminole
Taiwanese
$34,385
MEDIAN FEMALE EARNINGS
0.0/ 100
METRIC RATING
323rd/ 347
METRIC RANK
$40,576
MEDIAN FEMALE EARNINGS
86.1/ 100
METRIC RATING
138th/ 347
METRIC RANK
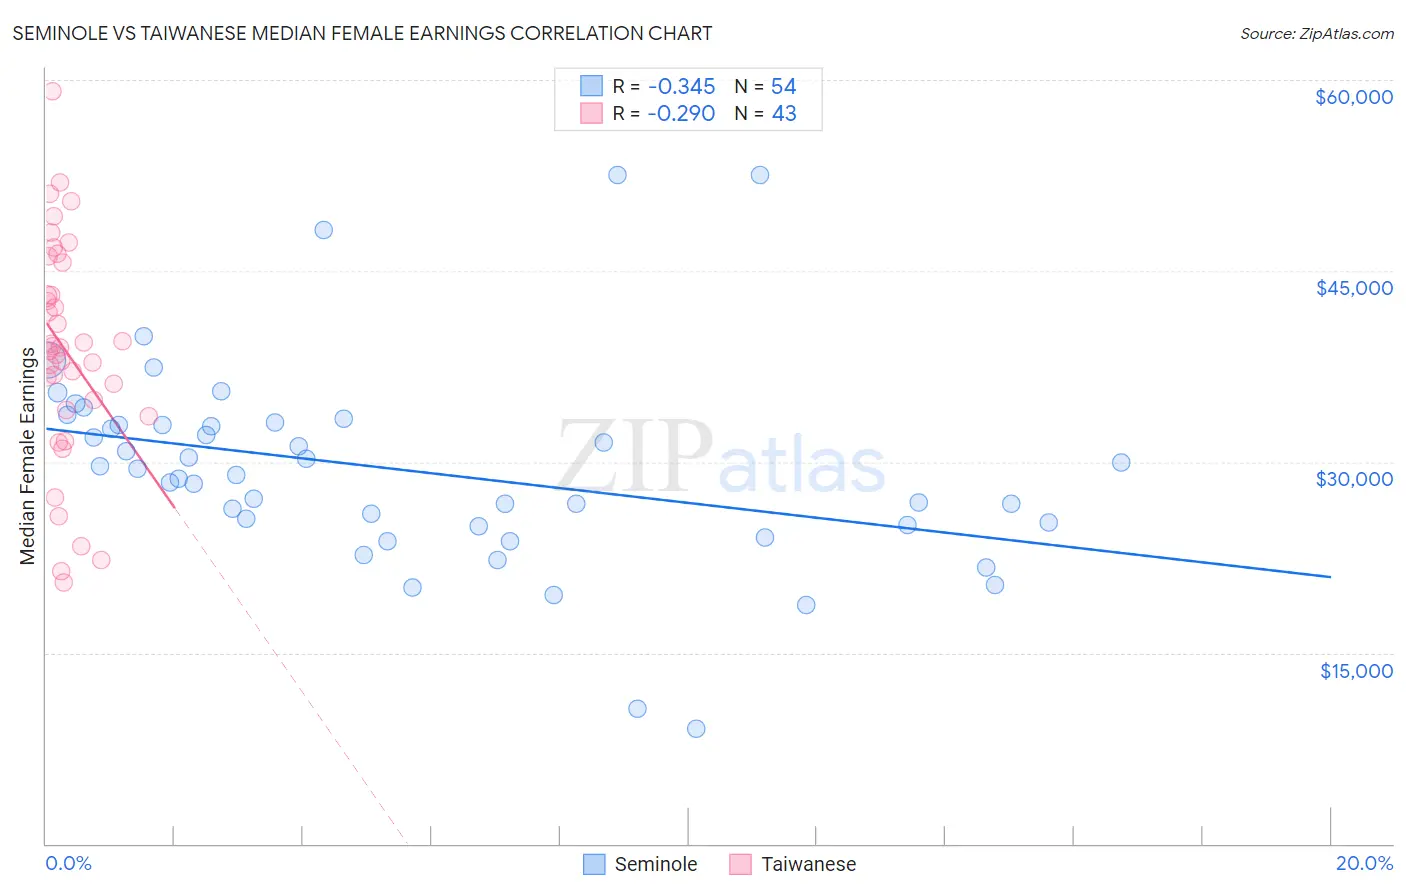
Seminole vs Taiwanese Median Female Earnings Correlation Chart
The statistical analysis conducted on geographies consisting of 118,266,998 people shows a mild negative correlation between the proportion of Seminole and median female earnings in the United States with a correlation coefficient (R) of -0.345 and weighted average of $34,385. Similarly, the statistical analysis conducted on geographies consisting of 31,721,885 people shows a weak negative correlation between the proportion of Taiwanese and median female earnings in the United States with a correlation coefficient (R) of -0.290 and weighted average of $40,576, a difference of 18.0%.
Median Female Earnings Correlation Summary
| Measurement | Seminole | Taiwanese |
| Minimum | $9,041 | $20,555 |
| Maximum | $52,528 | $59,093 |
| Range | $43,487 | $38,538 |
| Mean | $29,347 | $38,751 |
| Median | $29,210 | $39,019 |
| Interquartile 25% (IQ1) | $25,000 | $34,095 |
| Interquartile 75% (IQ3) | $32,861 | $45,655 |
| Interquartile Range (IQR) | $7,861 | $11,560 |
| Standard Deviation (Sample) | $8,052 | $8,643 |
| Standard Deviation (Population) | $7,977 | $8,542 |
Similar Demographics by Median Female Earnings
Demographics Similar to Seminole by Median Female Earnings
In terms of median female earnings, the demographic groups most similar to Seminole are Chickasaw ($34,414, a difference of 0.080%), Hispanic or Latino ($34,421, a difference of 0.11%), Immigrants from Congo ($34,317, a difference of 0.20%), Immigrants from Honduras ($34,647, a difference of 0.76%), and Dutch West Indian ($34,106, a difference of 0.82%).
| Demographics | Rating | Rank | Median Female Earnings |
| Cherokee | 0.0 /100 | #316 | Tragic $34,742 |
| Potawatomi | 0.0 /100 | #317 | Tragic $34,739 |
| Immigrants | Yemen | 0.0 /100 | #318 | Tragic $34,693 |
| Shoshone | 0.0 /100 | #319 | Tragic $34,677 |
| Immigrants | Honduras | 0.0 /100 | #320 | Tragic $34,647 |
| Hispanics or Latinos | 0.0 /100 | #321 | Tragic $34,421 |
| Chickasaw | 0.0 /100 | #322 | Tragic $34,414 |
| Seminole | 0.0 /100 | #323 | Tragic $34,385 |
| Immigrants | Congo | 0.0 /100 | #324 | Tragic $34,317 |
| Dutch West Indians | 0.0 /100 | #325 | Tragic $34,106 |
| Kiowa | 0.0 /100 | #326 | Tragic $34,074 |
| Cajuns | 0.0 /100 | #327 | Tragic $34,034 |
| Immigrants | Central America | 0.0 /100 | #328 | Tragic $33,953 |
| Hopi | 0.0 /100 | #329 | Tragic $33,932 |
| Menominee | 0.0 /100 | #330 | Tragic $33,894 |
Demographics Similar to Taiwanese by Median Female Earnings
In terms of median female earnings, the demographic groups most similar to Taiwanese are Immigrants from South Eastern Asia ($40,558, a difference of 0.040%), Pakistani ($40,596, a difference of 0.050%), Serbian ($40,539, a difference of 0.090%), Immigrants from Eastern Africa ($40,644, a difference of 0.17%), and Immigrants from Syria ($40,499, a difference of 0.19%).
| Demographics | Rating | Rank | Median Female Earnings |
| Chileans | 90.0 /100 | #131 | Exceptional $40,757 |
| Immigrants | Uganda | 89.7 /100 | #132 | Excellent $40,739 |
| Syrians | 89.5 /100 | #133 | Excellent $40,727 |
| Arabs | 89.3 /100 | #134 | Excellent $40,718 |
| Immigrants | Nepal | 89.0 /100 | #135 | Excellent $40,704 |
| Immigrants | Eastern Africa | 87.7 /100 | #136 | Excellent $40,644 |
| Pakistanis | 86.6 /100 | #137 | Excellent $40,596 |
| Taiwanese | 86.1 /100 | #138 | Excellent $40,576 |
| Immigrants | South Eastern Asia | 85.7 /100 | #139 | Excellent $40,558 |
| Serbians | 85.2 /100 | #140 | Excellent $40,539 |
| Immigrants | Syria | 84.1 /100 | #141 | Excellent $40,499 |
| Sri Lankans | 84.0 /100 | #142 | Excellent $40,496 |
| Northern Europeans | 83.9 /100 | #143 | Excellent $40,491 |
| Immigrants | North Macedonia | 83.8 /100 | #144 | Excellent $40,488 |
| Brazilians | 83.6 /100 | #145 | Excellent $40,483 |