Scottish vs Peruvian Unemployment Among Ages 20 to 24 years
COMPARE
Scottish
Peruvian
Unemployment Among Ages 20 to 24 years
Unemployment Among Ages 20 to 24 years Comparison
Scottish
Peruvians
9.8%
UNEMPLOYMENT AMONG AGES 20 TO 24 YEARS
99.3/ 100
METRIC RATING
66th/ 347
METRIC RANK
10.5%
UNEMPLOYMENT AMONG AGES 20 TO 24 YEARS
17.2/ 100
METRIC RATING
209th/ 347
METRIC RANK
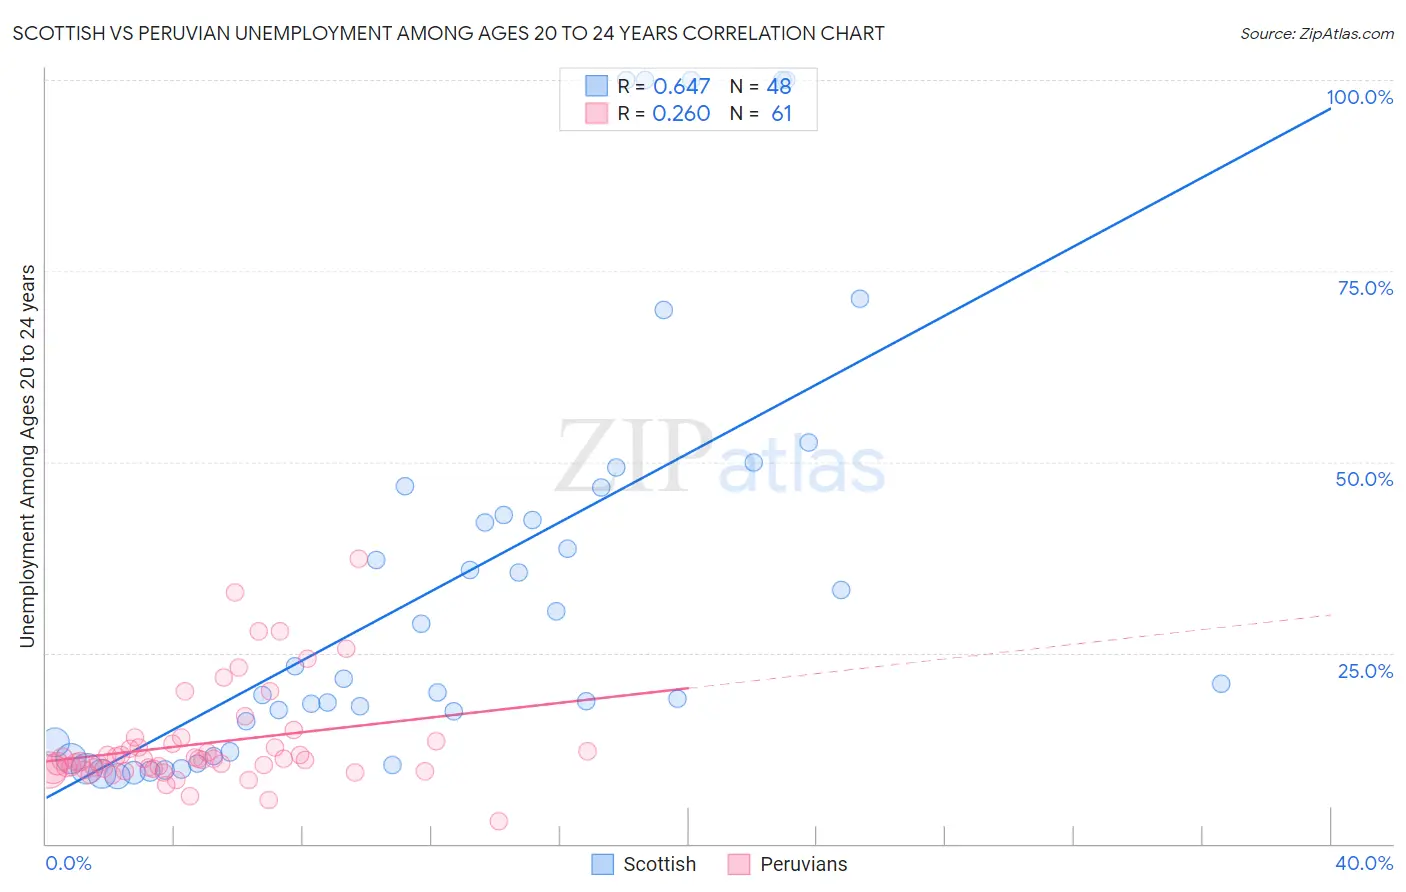
Scottish vs Peruvian Unemployment Among Ages 20 to 24 years Correlation Chart
The statistical analysis conducted on geographies consisting of 518,915,873 people shows a significant positive correlation between the proportion of Scottish and unemployment rate among population between the ages 20 and 24 in the United States with a correlation coefficient (R) of 0.647 and weighted average of 9.8%. Similarly, the statistical analysis conducted on geographies consisting of 355,365,601 people shows a weak positive correlation between the proportion of Peruvians and unemployment rate among population between the ages 20 and 24 in the United States with a correlation coefficient (R) of 0.260 and weighted average of 10.5%, a difference of 6.2%.
Unemployment Among Ages 20 to 24 years Correlation Summary
| Measurement | Scottish | Peruvian |
| Minimum | 8.8% | 2.9% |
| Maximum | 100.0% | 37.3% |
| Range | 91.2% | 34.4% |
| Mean | 34.1% | 13.1% |
| Median | 21.3% | 11.1% |
| Interquartile 25% (IQ1) | 12.6% | 9.8% |
| Interquartile 75% (IQ3) | 44.9% | 13.3% |
| Interquartile Range (IQR) | 32.2% | 3.5% |
| Standard Deviation (Sample) | 27.7% | 6.5% |
| Standard Deviation (Population) | 27.4% | 6.4% |
Similar Demographics by Unemployment Among Ages 20 to 24 years
Demographics Similar to Scottish by Unemployment Among Ages 20 to 24 years
In terms of unemployment among ages 20 to 24 years, the demographic groups most similar to Scottish are Welsh (9.8%, a difference of 0.080%), Immigrants from Bolivia (9.9%, a difference of 0.11%), British (9.8%, a difference of 0.15%), Serbian (9.8%, a difference of 0.15%), and Immigrants from Singapore (9.8%, a difference of 0.16%).
| Demographics | Rating | Rank | Unemployment Among Ages 20 to 24 years |
| English | 99.5 /100 | #59 | Exceptional 9.8% |
| Immigrants | Kuwait | 99.5 /100 | #60 | Exceptional 9.8% |
| Malaysians | 99.5 /100 | #61 | Exceptional 9.8% |
| Immigrants | Singapore | 99.4 /100 | #62 | Exceptional 9.8% |
| British | 99.4 /100 | #63 | Exceptional 9.8% |
| Serbians | 99.4 /100 | #64 | Exceptional 9.8% |
| Welsh | 99.3 /100 | #65 | Exceptional 9.8% |
| Scottish | 99.3 /100 | #66 | Exceptional 9.8% |
| Immigrants | Bolivia | 99.2 /100 | #67 | Exceptional 9.9% |
| Mongolians | 99.1 /100 | #68 | Exceptional 9.9% |
| Bulgarians | 99.1 /100 | #69 | Exceptional 9.9% |
| Immigrants | Croatia | 99.0 /100 | #70 | Exceptional 9.9% |
| Celtics | 98.9 /100 | #71 | Exceptional 9.9% |
| Bolivians | 98.9 /100 | #72 | Exceptional 9.9% |
| Kenyans | 98.7 /100 | #73 | Exceptional 9.9% |
Demographics Similar to Peruvians by Unemployment Among Ages 20 to 24 years
In terms of unemployment among ages 20 to 24 years, the demographic groups most similar to Peruvians are Immigrants from Belgium (10.5%, a difference of 0.020%), Immigrants from Hong Kong (10.5%, a difference of 0.030%), Immigrants from Honduras (10.4%, a difference of 0.050%), Immigrants from Europe (10.4%, a difference of 0.080%), and Cypriot (10.4%, a difference of 0.11%).
| Demographics | Rating | Rank | Unemployment Among Ages 20 to 24 years |
| Immigrants | Middle Africa | 20.9 /100 | #202 | Fair 10.4% |
| South Americans | 20.6 /100 | #203 | Fair 10.4% |
| Immigrants | Northern Europe | 19.5 /100 | #204 | Poor 10.4% |
| Cypriots | 18.9 /100 | #205 | Poor 10.4% |
| Immigrants | Europe | 18.5 /100 | #206 | Poor 10.4% |
| Immigrants | Honduras | 17.9 /100 | #207 | Poor 10.4% |
| Immigrants | Hong Kong | 17.6 /100 | #208 | Poor 10.5% |
| Peruvians | 17.2 /100 | #209 | Poor 10.5% |
| Immigrants | Belgium | 16.9 /100 | #210 | Poor 10.5% |
| Immigrants | Guatemala | 14.6 /100 | #211 | Poor 10.5% |
| Immigrants | Sri Lanka | 14.0 /100 | #212 | Poor 10.5% |
| Guatemalans | 12.2 /100 | #213 | Poor 10.5% |
| Kiowa | 11.7 /100 | #214 | Poor 10.5% |
| Hondurans | 10.5 /100 | #215 | Poor 10.5% |
| Costa Ricans | 9.6 /100 | #216 | Tragic 10.5% |