Scottish vs Yakama Median Female Earnings
COMPARE
Scottish
Yakama
Median Female Earnings
Median Female Earnings Comparison
Scottish
Yakama
$38,397
MEDIAN FEMALE EARNINGS
6.3/ 100
METRIC RATING
227th/ 347
METRIC RANK
$33,354
MEDIAN FEMALE EARNINGS
0.0/ 100
METRIC RATING
337th/ 347
METRIC RANK
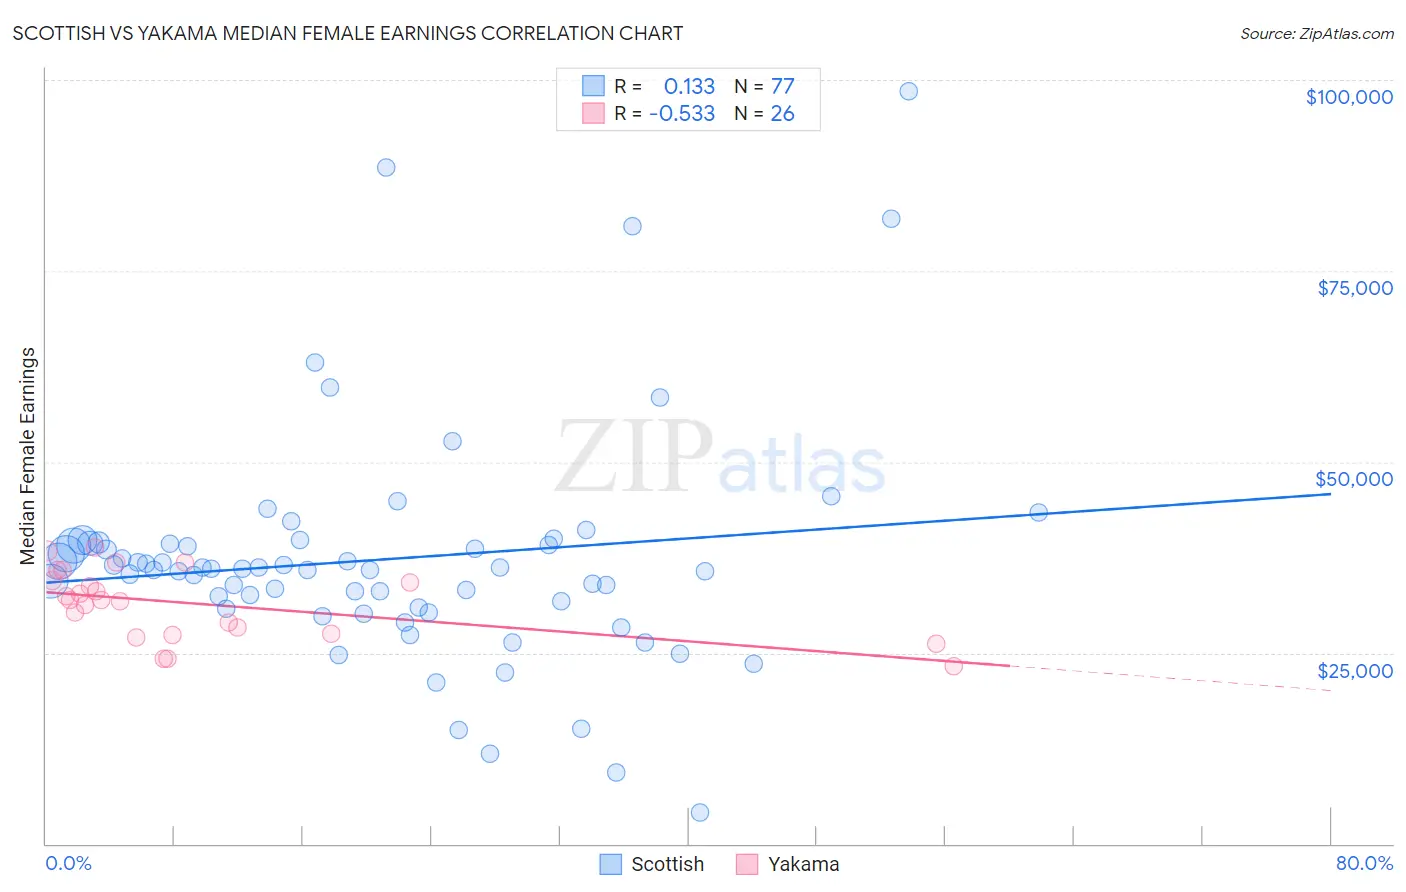
Scottish vs Yakama Median Female Earnings Correlation Chart
The statistical analysis conducted on geographies consisting of 565,316,168 people shows a poor positive correlation between the proportion of Scottish and median female earnings in the United States with a correlation coefficient (R) of 0.133 and weighted average of $38,397. Similarly, the statistical analysis conducted on geographies consisting of 19,910,730 people shows a substantial negative correlation between the proportion of Yakama and median female earnings in the United States with a correlation coefficient (R) of -0.533 and weighted average of $33,354, a difference of 15.1%.
Median Female Earnings Correlation Summary
| Measurement | Scottish | Yakama |
| Minimum | $4,115 | $23,214 |
| Maximum | $98,472 | $38,750 |
| Range | $94,357 | $15,536 |
| Mean | $37,218 | $31,429 |
| Median | $35,990 | $31,931 |
| Interquartile 25% (IQ1) | $30,914 | $27,516 |
| Interquartile 75% (IQ3) | $39,333 | $34,456 |
| Interquartile Range (IQR) | $8,419 | $6,940 |
| Standard Deviation (Sample) | $15,319 | $4,456 |
| Standard Deviation (Population) | $15,219 | $4,370 |
Similar Demographics by Median Female Earnings
Demographics Similar to Scottish by Median Female Earnings
In terms of median female earnings, the demographic groups most similar to Scottish are Subsaharan African ($38,391, a difference of 0.020%), Belgian ($38,382, a difference of 0.040%), French Canadian ($38,436, a difference of 0.10%), Basque ($38,352, a difference of 0.12%), and French ($38,457, a difference of 0.15%).
| Demographics | Rating | Rank | Median Female Earnings |
| Yugoslavians | 8.8 /100 | #220 | Tragic $38,573 |
| Immigrants | Azores | 8.8 /100 | #221 | Tragic $38,573 |
| Japanese | 8.1 /100 | #222 | Tragic $38,528 |
| Immigrants | Sudan | 7.8 /100 | #223 | Tragic $38,511 |
| Native Hawaiians | 7.1 /100 | #224 | Tragic $38,461 |
| French | 7.0 /100 | #225 | Tragic $38,457 |
| French Canadians | 6.8 /100 | #226 | Tragic $38,436 |
| Scottish | 6.3 /100 | #227 | Tragic $38,397 |
| Sub-Saharan Africans | 6.2 /100 | #228 | Tragic $38,391 |
| Belgians | 6.1 /100 | #229 | Tragic $38,382 |
| Basques | 5.7 /100 | #230 | Tragic $38,352 |
| Somalis | 5.5 /100 | #231 | Tragic $38,333 |
| Scandinavians | 5.2 /100 | #232 | Tragic $38,306 |
| Tongans | 5.1 /100 | #233 | Tragic $38,288 |
| Celtics | 5.0 /100 | #234 | Tragic $38,283 |
Demographics Similar to Yakama by Median Female Earnings
In terms of median female earnings, the demographic groups most similar to Yakama are Ottawa ($33,378, a difference of 0.070%), Immigrants from Cuba ($33,291, a difference of 0.19%), Creek ($33,437, a difference of 0.25%), Immigrants from Mexico ($33,236, a difference of 0.36%), and Tohono O'odham ($33,205, a difference of 0.45%).
| Demographics | Rating | Rank | Median Female Earnings |
| Menominee | 0.0 /100 | #330 | Tragic $33,894 |
| Natives/Alaskans | 0.0 /100 | #331 | Tragic $33,806 |
| Choctaw | 0.0 /100 | #332 | Tragic $33,775 |
| Mexicans | 0.0 /100 | #333 | Tragic $33,664 |
| Spanish American Indians | 0.0 /100 | #334 | Tragic $33,625 |
| Creek | 0.0 /100 | #335 | Tragic $33,437 |
| Ottawa | 0.0 /100 | #336 | Tragic $33,378 |
| Yakama | 0.0 /100 | #337 | Tragic $33,354 |
| Immigrants | Cuba | 0.0 /100 | #338 | Tragic $33,291 |
| Immigrants | Mexico | 0.0 /100 | #339 | Tragic $33,236 |
| Tohono O'odham | 0.0 /100 | #340 | Tragic $33,205 |
| Navajo | 0.0 /100 | #341 | Tragic $33,046 |
| Yup'ik | 0.0 /100 | #342 | Tragic $32,730 |
| Pueblo | 0.0 /100 | #343 | Tragic $32,564 |
| Lumbee | 0.0 /100 | #344 | Tragic $32,500 |