Scottish vs Immigrants from France Householder Income Ages 45 - 64 years
COMPARE
Scottish
Immigrants from France
Householder Income Ages 45 - 64 years
Householder Income Ages 45 - 64 years Comparison
Scottish
Immigrants from France
$102,123
HOUSEHOLDER INCOME AGES 45 - 64 YEARS
71.1/ 100
METRIC RATING
162nd/ 347
METRIC RANK
$113,680
HOUSEHOLDER INCOME AGES 45 - 64 YEARS
99.9/ 100
METRIC RATING
45th/ 347
METRIC RANK
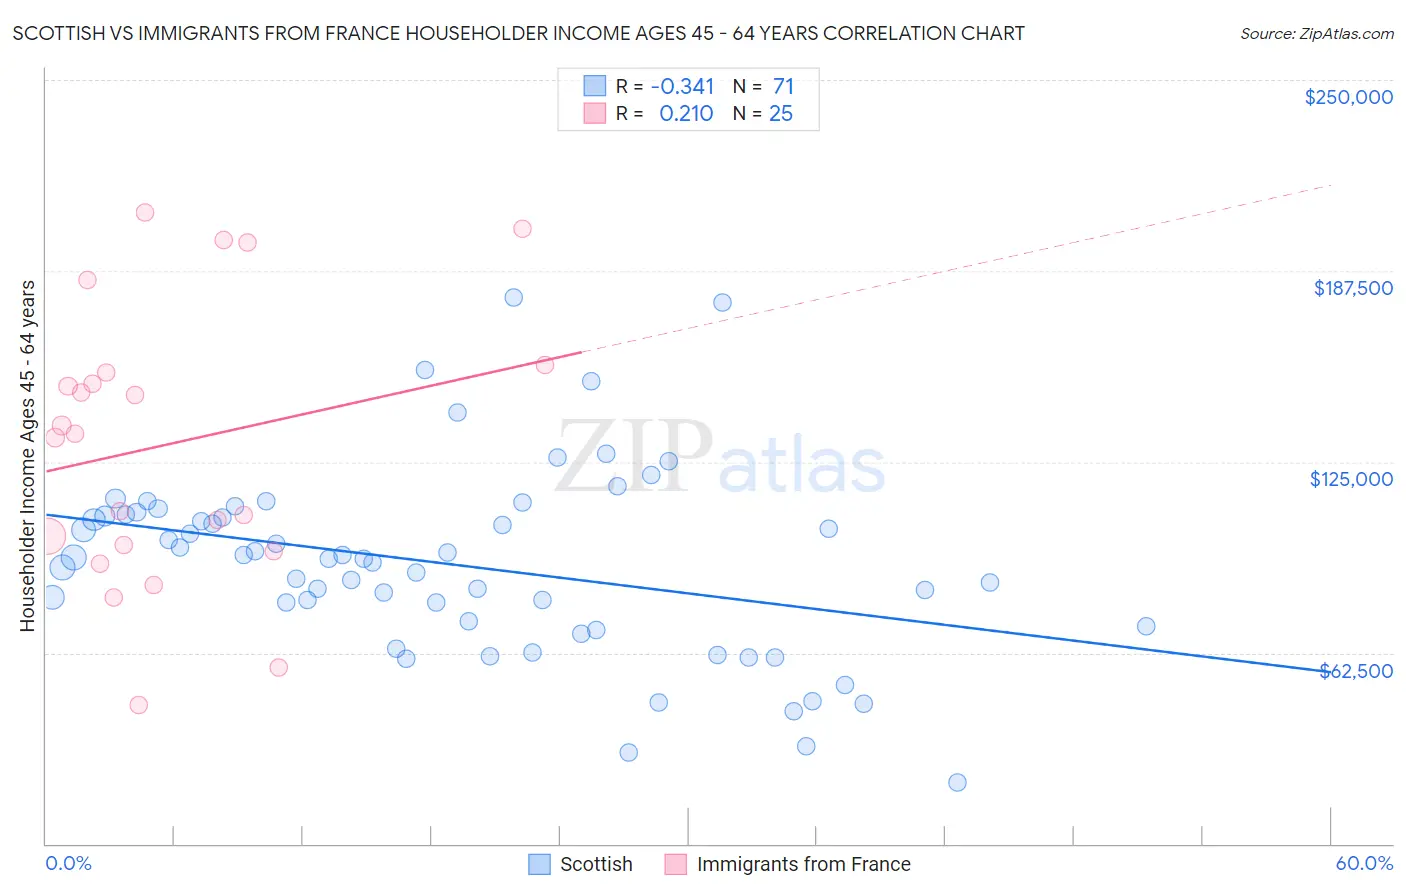
Scottish vs Immigrants from France Householder Income Ages 45 - 64 years Correlation Chart
The statistical analysis conducted on geographies consisting of 563,389,205 people shows a mild negative correlation between the proportion of Scottish and household income with householder between the ages 45 and 64 in the United States with a correlation coefficient (R) of -0.341 and weighted average of $102,123. Similarly, the statistical analysis conducted on geographies consisting of 287,674,634 people shows a weak positive correlation between the proportion of Immigrants from France and household income with householder between the ages 45 and 64 in the United States with a correlation coefficient (R) of 0.210 and weighted average of $113,680, a difference of 11.3%.
Householder Income Ages 45 - 64 years Correlation Summary
| Measurement | Scottish | Immigrants from France |
| Minimum | $20,057 | $45,521 |
| Maximum | $179,004 | $206,746 |
| Range | $158,947 | $161,225 |
| Mean | $91,449 | $130,914 |
| Median | $93,434 | $134,293 |
| Interquartile 25% (IQ1) | $71,369 | $96,696 |
| Interquartile 75% (IQ3) | $107,815 | $155,402 |
| Interquartile Range (IQR) | $36,446 | $58,706 |
| Standard Deviation (Sample) | $30,831 | $45,085 |
| Standard Deviation (Population) | $30,613 | $44,174 |
Similar Demographics by Householder Income Ages 45 - 64 years
Demographics Similar to Scottish by Householder Income Ages 45 - 64 years
In terms of householder income ages 45 - 64 years, the demographic groups most similar to Scottish are Immigrants from Nepal ($102,190, a difference of 0.070%), English ($102,021, a difference of 0.10%), Immigrants from Morocco ($102,015, a difference of 0.11%), Icelander ($102,261, a difference of 0.14%), and Immigrants from Albania ($101,957, a difference of 0.16%).
| Demographics | Rating | Rank | Householder Income Ages 45 - 64 years |
| Costa Ricans | 77.4 /100 | #155 | Good $102,779 |
| Carpatho Rusyns | 77.4 /100 | #156 | Good $102,777 |
| Immigrants | Ethiopia | 77.3 /100 | #157 | Good $102,763 |
| Slavs | 76.1 /100 | #158 | Good $102,629 |
| Sierra Leoneans | 74.2 /100 | #159 | Good $102,427 |
| Icelanders | 72.5 /100 | #160 | Good $102,261 |
| Immigrants | Nepal | 71.8 /100 | #161 | Good $102,190 |
| Scottish | 71.1 /100 | #162 | Good $102,123 |
| English | 70.1 /100 | #163 | Good $102,021 |
| Immigrants | Morocco | 70.0 /100 | #164 | Good $102,015 |
| Immigrants | Albania | 69.4 /100 | #165 | Good $101,957 |
| Samoans | 65.3 /100 | #166 | Good $101,580 |
| Czechoslovakians | 63.0 /100 | #167 | Good $101,387 |
| South American Indians | 60.5 /100 | #168 | Good $101,171 |
| Guamanians/Chamorros | 60.5 /100 | #169 | Good $101,170 |
Demographics Similar to Immigrants from France by Householder Income Ages 45 - 64 years
In terms of householder income ages 45 - 64 years, the demographic groups most similar to Immigrants from France are Immigrants from Greece ($113,548, a difference of 0.12%), Australian ($113,533, a difference of 0.13%), Immigrants from Indonesia ($113,519, a difference of 0.14%), Bulgarian ($113,883, a difference of 0.18%), and Immigrants from Russia ($113,215, a difference of 0.41%).
| Demographics | Rating | Rank | Householder Income Ages 45 - 64 years |
| Immigrants | Pakistan | 99.9 /100 | #38 | Exceptional $114,434 |
| Immigrants | Turkey | 99.9 /100 | #39 | Exceptional $114,407 |
| Cambodians | 99.9 /100 | #40 | Exceptional $114,342 |
| Immigrants | Lithuania | 99.9 /100 | #41 | Exceptional $114,336 |
| Estonians | 99.9 /100 | #42 | Exceptional $114,220 |
| Israelis | 99.9 /100 | #43 | Exceptional $114,186 |
| Bulgarians | 99.9 /100 | #44 | Exceptional $113,883 |
| Immigrants | France | 99.9 /100 | #45 | Exceptional $113,680 |
| Immigrants | Greece | 99.9 /100 | #46 | Exceptional $113,548 |
| Australians | 99.9 /100 | #47 | Exceptional $113,533 |
| Immigrants | Indonesia | 99.9 /100 | #48 | Exceptional $113,519 |
| Immigrants | Russia | 99.8 /100 | #49 | Exceptional $113,215 |
| Immigrants | Austria | 99.8 /100 | #50 | Exceptional $113,140 |
| Immigrants | South Africa | 99.8 /100 | #51 | Exceptional $112,886 |
| Immigrants | Malaysia | 99.8 /100 | #52 | Exceptional $112,796 |