Asian vs Immigrants from France Householder Income Ages 45 - 64 years
COMPARE
Asian
Immigrants from France
Householder Income Ages 45 - 64 years
Householder Income Ages 45 - 64 years Comparison
Asians
Immigrants from France
$118,426
HOUSEHOLDER INCOME AGES 45 - 64 YEARS
100.0/ 100
METRIC RATING
25th/ 347
METRIC RANK
$113,680
HOUSEHOLDER INCOME AGES 45 - 64 YEARS
99.9/ 100
METRIC RATING
45th/ 347
METRIC RANK
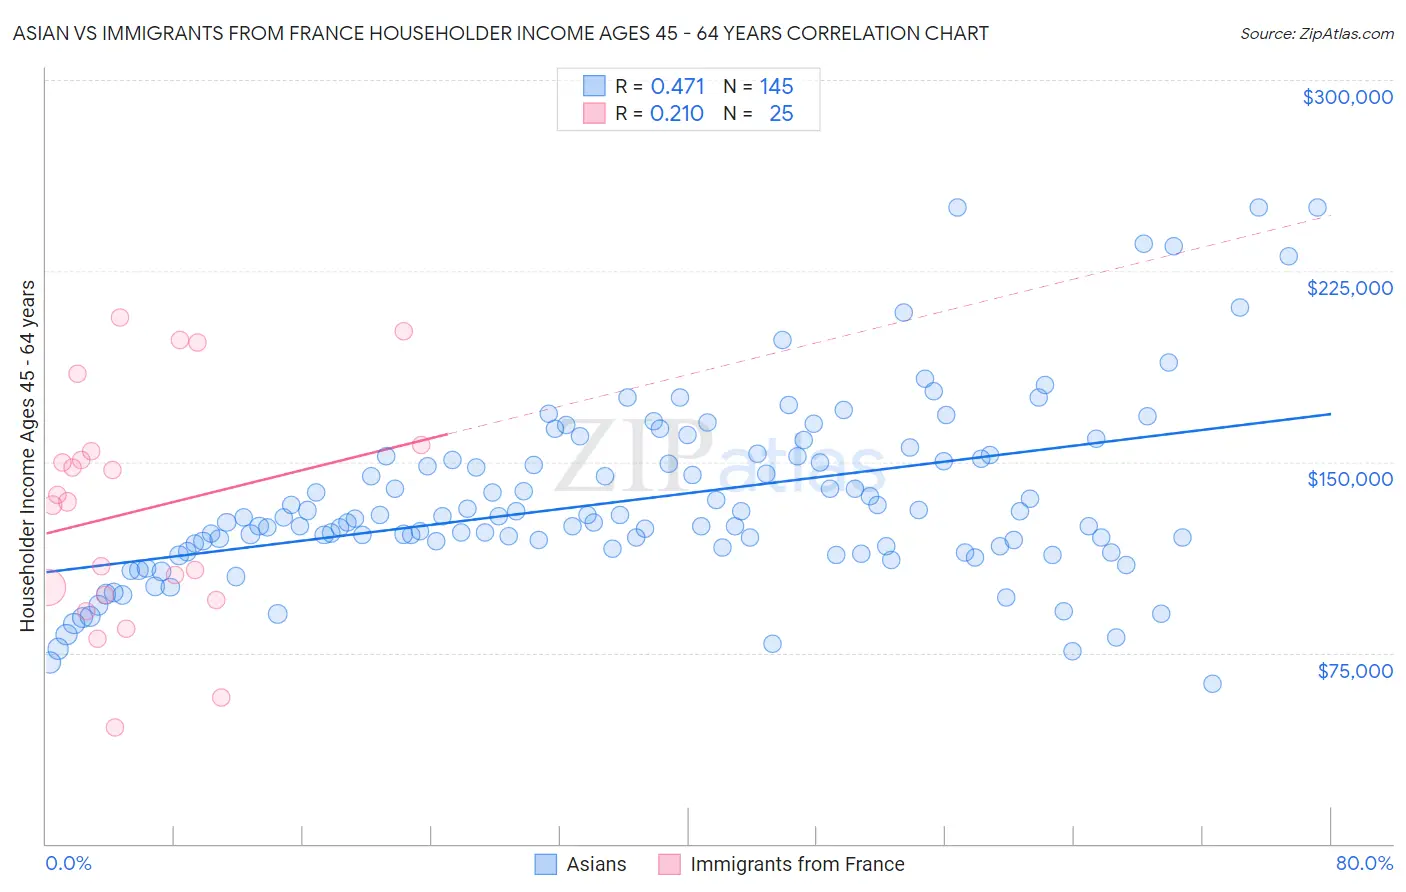
Asian vs Immigrants from France Householder Income Ages 45 - 64 years Correlation Chart
The statistical analysis conducted on geographies consisting of 548,262,581 people shows a moderate positive correlation between the proportion of Asians and household income with householder between the ages 45 and 64 in the United States with a correlation coefficient (R) of 0.471 and weighted average of $118,426. Similarly, the statistical analysis conducted on geographies consisting of 287,674,634 people shows a weak positive correlation between the proportion of Immigrants from France and household income with householder between the ages 45 and 64 in the United States with a correlation coefficient (R) of 0.210 and weighted average of $113,680, a difference of 4.2%.
Householder Income Ages 45 - 64 years Correlation Summary
| Measurement | Asian | Immigrants from France |
| Minimum | $62,982 | $45,521 |
| Maximum | $250,001 | $206,746 |
| Range | $187,019 | $161,225 |
| Mean | $135,000 | $130,914 |
| Median | $127,763 | $134,293 |
| Interquartile 25% (IQ1) | $116,265 | $96,696 |
| Interquartile 75% (IQ3) | $151,736 | $155,402 |
| Interquartile Range (IQR) | $35,471 | $58,706 |
| Standard Deviation (Sample) | $35,213 | $45,085 |
| Standard Deviation (Population) | $35,092 | $44,174 |
Demographics Similar to Asians and Immigrants from France by Householder Income Ages 45 - 64 years
In terms of householder income ages 45 - 64 years, the demographic groups most similar to Asians are Immigrants from Sweden ($118,318, a difference of 0.090%), Immigrants from Northern Europe ($117,930, a difference of 0.42%), Turkish ($117,814, a difference of 0.52%), Bhutanese ($117,750, a difference of 0.57%), and Immigrants from Bolivia ($117,731, a difference of 0.59%). Similarly, the demographic groups most similar to Immigrants from France are Bulgarian ($113,883, a difference of 0.18%), Israeli ($114,186, a difference of 0.44%), Estonian ($114,220, a difference of 0.47%), Cambodian ($114,342, a difference of 0.58%), and Immigrants from Lithuania ($114,336, a difference of 0.58%).
| Demographics | Rating | Rank | Householder Income Ages 45 - 64 years |
| Asians | 100.0 /100 | #25 | Exceptional $118,426 |
| Immigrants | Sweden | 100.0 /100 | #26 | Exceptional $118,318 |
| Immigrants | Northern Europe | 100.0 /100 | #27 | Exceptional $117,930 |
| Turks | 100.0 /100 | #28 | Exceptional $117,814 |
| Bhutanese | 100.0 /100 | #29 | Exceptional $117,750 |
| Immigrants | Bolivia | 100.0 /100 | #30 | Exceptional $117,731 |
| Immigrants | Asia | 100.0 /100 | #31 | Exceptional $116,566 |
| Russians | 100.0 /100 | #32 | Exceptional $116,328 |
| Chinese | 100.0 /100 | #33 | Exceptional $116,156 |
| Immigrants | Denmark | 100.0 /100 | #34 | Exceptional $116,000 |
| Latvians | 100.0 /100 | #35 | Exceptional $115,957 |
| Immigrants | Switzerland | 100.0 /100 | #36 | Exceptional $115,934 |
| Maltese | 99.9 /100 | #37 | Exceptional $114,754 |
| Immigrants | Pakistan | 99.9 /100 | #38 | Exceptional $114,434 |
| Immigrants | Turkey | 99.9 /100 | #39 | Exceptional $114,407 |
| Cambodians | 99.9 /100 | #40 | Exceptional $114,342 |
| Immigrants | Lithuania | 99.9 /100 | #41 | Exceptional $114,336 |
| Estonians | 99.9 /100 | #42 | Exceptional $114,220 |
| Israelis | 99.9 /100 | #43 | Exceptional $114,186 |
| Bulgarians | 99.9 /100 | #44 | Exceptional $113,883 |
| Immigrants | France | 99.9 /100 | #45 | Exceptional $113,680 |