Immigrants from Uruguay vs Immigrants from France Householder Income Ages 45 - 64 years
COMPARE
Immigrants from Uruguay
Immigrants from France
Householder Income Ages 45 - 64 years
Householder Income Ages 45 - 64 years Comparison
Immigrants from Uruguay
Immigrants from France
$96,086
HOUSEHOLDER INCOME AGES 45 - 64 YEARS
10.7/ 100
METRIC RATING
213th/ 347
METRIC RANK
$113,680
HOUSEHOLDER INCOME AGES 45 - 64 YEARS
99.9/ 100
METRIC RATING
45th/ 347
METRIC RANK
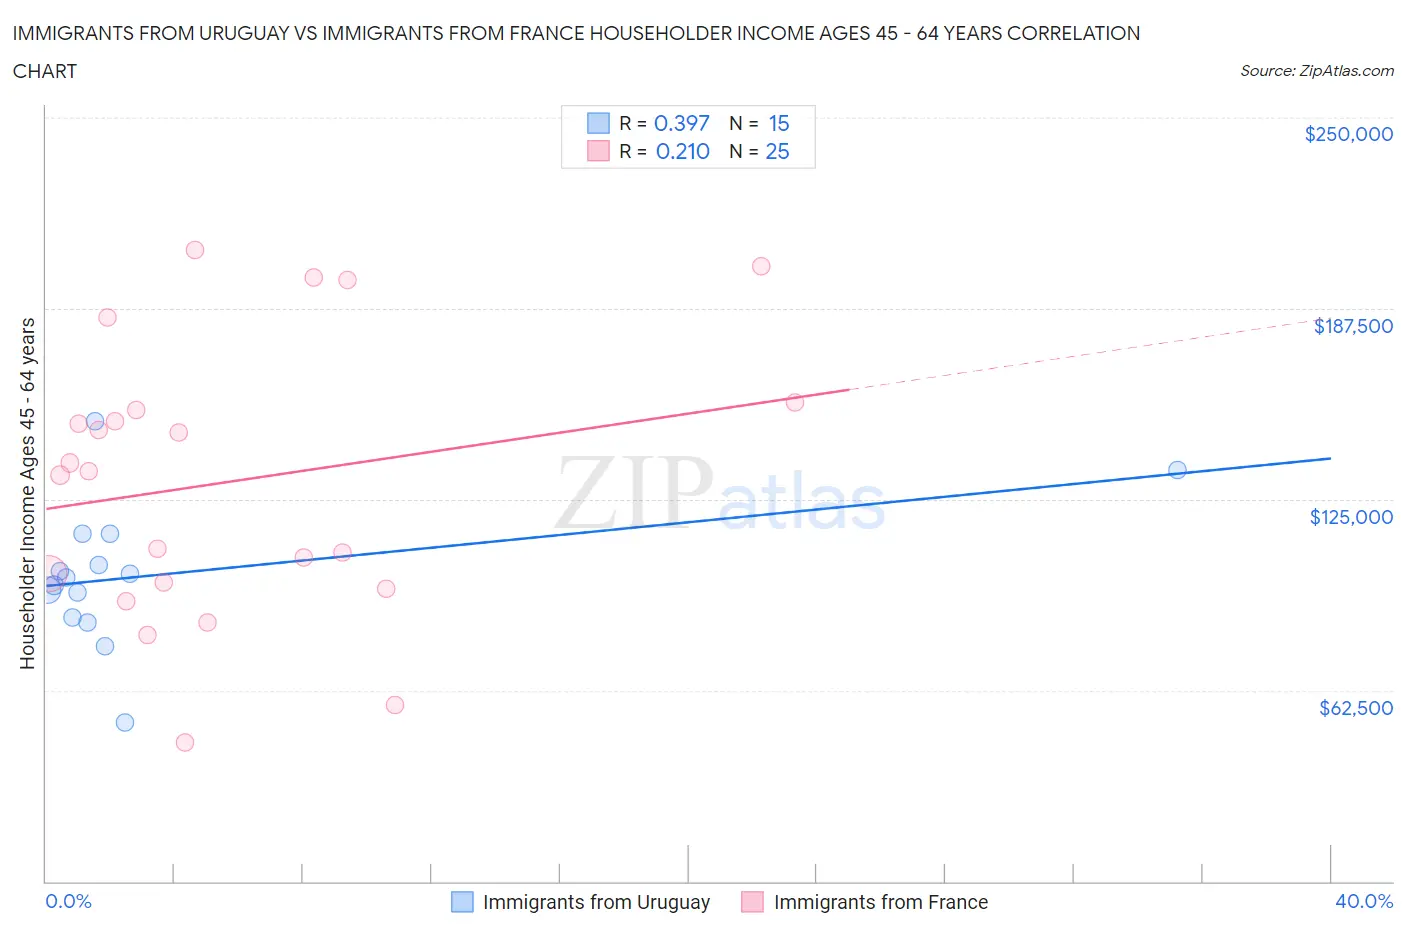
Immigrants from Uruguay vs Immigrants from France Householder Income Ages 45 - 64 years Correlation Chart
The statistical analysis conducted on geographies consisting of 133,207,341 people shows a mild positive correlation between the proportion of Immigrants from Uruguay and household income with householder between the ages 45 and 64 in the United States with a correlation coefficient (R) of 0.397 and weighted average of $96,086. Similarly, the statistical analysis conducted on geographies consisting of 287,674,634 people shows a weak positive correlation between the proportion of Immigrants from France and household income with householder between the ages 45 and 64 in the United States with a correlation coefficient (R) of 0.210 and weighted average of $113,680, a difference of 18.3%.
Householder Income Ages 45 - 64 years Correlation Summary
| Measurement | Immigrants from Uruguay | Immigrants from France |
| Minimum | $51,929 | $45,521 |
| Maximum | $150,685 | $206,746 |
| Range | $98,756 | $161,225 |
| Mean | $100,358 | $130,914 |
| Median | $99,578 | $134,293 |
| Interquartile 25% (IQ1) | $86,473 | $96,696 |
| Interquartile 75% (IQ3) | $113,852 | $155,402 |
| Interquartile Range (IQR) | $27,380 | $58,706 |
| Standard Deviation (Sample) | $23,140 | $45,085 |
| Standard Deviation (Population) | $22,356 | $44,174 |
Similar Demographics by Householder Income Ages 45 - 64 years
Demographics Similar to Immigrants from Uruguay by Householder Income Ages 45 - 64 years
In terms of householder income ages 45 - 64 years, the demographic groups most similar to Immigrants from Uruguay are Panamanian ($96,066, a difference of 0.020%), Venezuelan ($96,460, a difference of 0.39%), Immigrants from Cambodia ($96,537, a difference of 0.47%), Nigerian ($95,492, a difference of 0.62%), and Tsimshian ($96,783, a difference of 0.73%).
| Demographics | Rating | Rank | Householder Income Ages 45 - 64 years |
| Immigrants | Africa | 17.9 /100 | #206 | Poor $97,284 |
| Ghanaians | 17.9 /100 | #207 | Poor $97,277 |
| Scotch-Irish | 16.4 /100 | #208 | Poor $97,073 |
| Japanese | 14.8 /100 | #209 | Poor $96,834 |
| Tsimshian | 14.5 /100 | #210 | Poor $96,783 |
| Immigrants | Cambodia | 13.0 /100 | #211 | Poor $96,537 |
| Venezuelans | 12.6 /100 | #212 | Poor $96,460 |
| Immigrants | Uruguay | 10.7 /100 | #213 | Poor $96,086 |
| Panamanians | 10.6 /100 | #214 | Poor $96,066 |
| Nigerians | 8.2 /100 | #215 | Tragic $95,492 |
| Immigrants | Venezuela | 7.6 /100 | #216 | Tragic $95,342 |
| Immigrants | Ghana | 6.4 /100 | #217 | Tragic $94,982 |
| Delaware | 6.2 /100 | #218 | Tragic $94,914 |
| Immigrants | Armenia | 6.1 /100 | #219 | Tragic $94,863 |
| Salvadorans | 6.0 /100 | #220 | Tragic $94,842 |
Demographics Similar to Immigrants from France by Householder Income Ages 45 - 64 years
In terms of householder income ages 45 - 64 years, the demographic groups most similar to Immigrants from France are Immigrants from Greece ($113,548, a difference of 0.12%), Australian ($113,533, a difference of 0.13%), Immigrants from Indonesia ($113,519, a difference of 0.14%), Bulgarian ($113,883, a difference of 0.18%), and Immigrants from Russia ($113,215, a difference of 0.41%).
| Demographics | Rating | Rank | Householder Income Ages 45 - 64 years |
| Immigrants | Pakistan | 99.9 /100 | #38 | Exceptional $114,434 |
| Immigrants | Turkey | 99.9 /100 | #39 | Exceptional $114,407 |
| Cambodians | 99.9 /100 | #40 | Exceptional $114,342 |
| Immigrants | Lithuania | 99.9 /100 | #41 | Exceptional $114,336 |
| Estonians | 99.9 /100 | #42 | Exceptional $114,220 |
| Israelis | 99.9 /100 | #43 | Exceptional $114,186 |
| Bulgarians | 99.9 /100 | #44 | Exceptional $113,883 |
| Immigrants | France | 99.9 /100 | #45 | Exceptional $113,680 |
| Immigrants | Greece | 99.9 /100 | #46 | Exceptional $113,548 |
| Australians | 99.9 /100 | #47 | Exceptional $113,533 |
| Immigrants | Indonesia | 99.9 /100 | #48 | Exceptional $113,519 |
| Immigrants | Russia | 99.8 /100 | #49 | Exceptional $113,215 |
| Immigrants | Austria | 99.8 /100 | #50 | Exceptional $113,140 |
| Immigrants | South Africa | 99.8 /100 | #51 | Exceptional $112,886 |
| Immigrants | Malaysia | 99.8 /100 | #52 | Exceptional $112,796 |