Immigrants from Norway vs Immigrants from France Householder Income Ages 45 - 64 years
COMPARE
Immigrants from Norway
Immigrants from France
Householder Income Ages 45 - 64 years
Householder Income Ages 45 - 64 years Comparison
Immigrants from Norway
Immigrants from France
$111,669
HOUSEHOLDER INCOME AGES 45 - 64 YEARS
99.7/ 100
METRIC RATING
62nd/ 347
METRIC RANK
$113,680
HOUSEHOLDER INCOME AGES 45 - 64 YEARS
99.9/ 100
METRIC RATING
45th/ 347
METRIC RANK
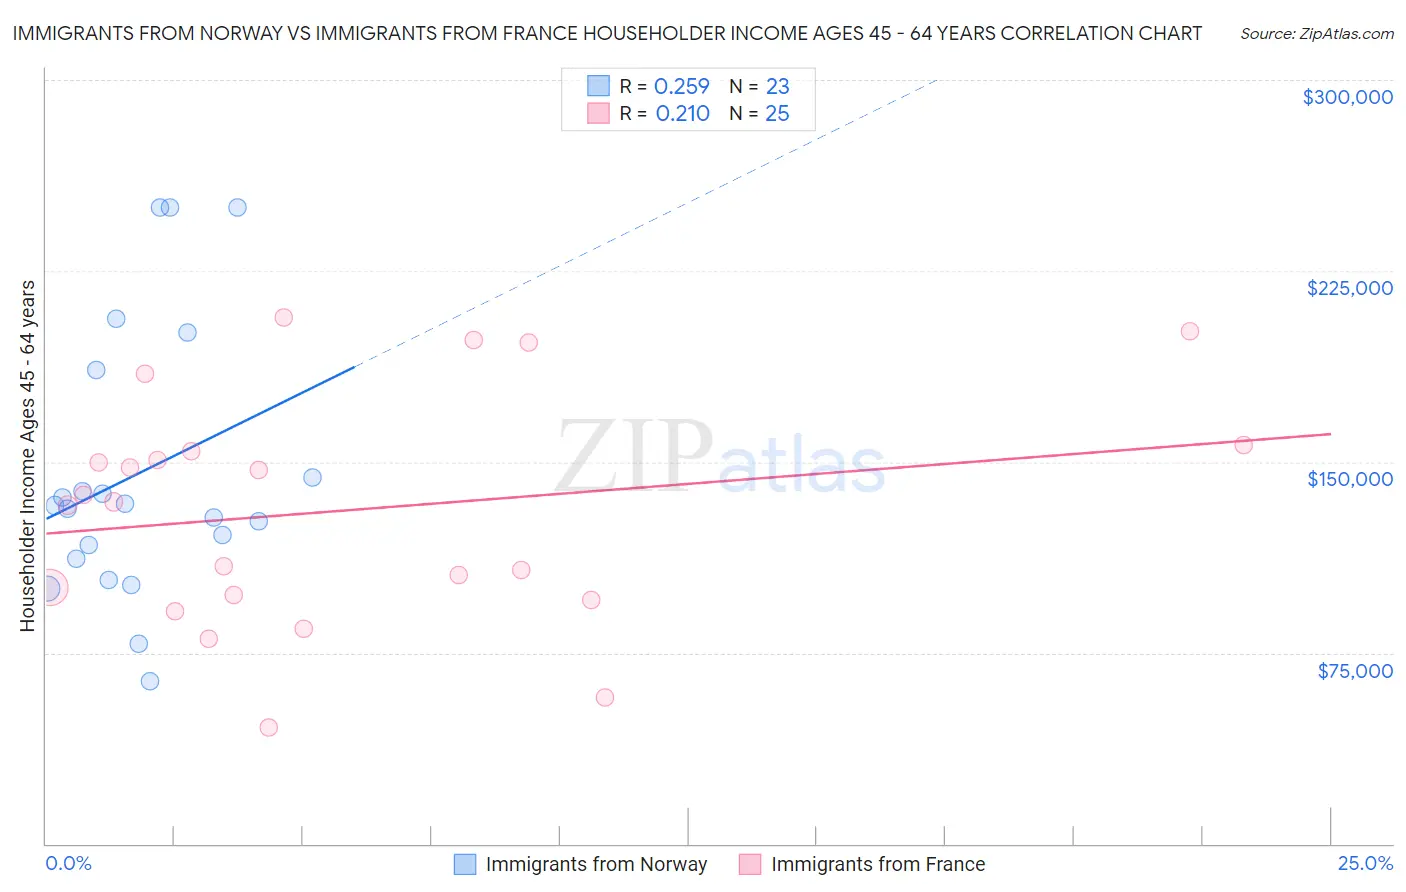
Immigrants from Norway vs Immigrants from France Householder Income Ages 45 - 64 years Correlation Chart
The statistical analysis conducted on geographies consisting of 116,657,782 people shows a weak positive correlation between the proportion of Immigrants from Norway and household income with householder between the ages 45 and 64 in the United States with a correlation coefficient (R) of 0.259 and weighted average of $111,669. Similarly, the statistical analysis conducted on geographies consisting of 287,674,634 people shows a weak positive correlation between the proportion of Immigrants from France and household income with householder between the ages 45 and 64 in the United States with a correlation coefficient (R) of 0.210 and weighted average of $113,680, a difference of 1.8%.
Householder Income Ages 45 - 64 years Correlation Summary
| Measurement | Immigrants from Norway | Immigrants from France |
| Minimum | $63,891 | $45,521 |
| Maximum | $250,001 | $206,746 |
| Range | $186,110 | $161,225 |
| Mean | $145,670 | $130,914 |
| Median | $132,825 | $134,293 |
| Interquartile 25% (IQ1) | $111,854 | $96,696 |
| Interquartile 75% (IQ3) | $186,082 | $155,402 |
| Interquartile Range (IQR) | $74,228 | $58,706 |
| Standard Deviation (Sample) | $53,028 | $45,085 |
| Standard Deviation (Population) | $51,863 | $44,174 |
Demographics Similar to Immigrants from Norway and Immigrants from France by Householder Income Ages 45 - 64 years
In terms of householder income ages 45 - 64 years, the demographic groups most similar to Immigrants from Norway are Mongolian ($111,602, a difference of 0.060%), Immigrants from Czechoslovakia ($111,914, a difference of 0.22%), Immigrants from Europe ($111,984, a difference of 0.28%), Immigrants from Netherlands ($111,982, a difference of 0.28%), and Soviet Union ($112,008, a difference of 0.30%). Similarly, the demographic groups most similar to Immigrants from France are Immigrants from Greece ($113,548, a difference of 0.12%), Australian ($113,533, a difference of 0.13%), Immigrants from Indonesia ($113,519, a difference of 0.14%), Bulgarian ($113,883, a difference of 0.18%), and Immigrants from Russia ($113,215, a difference of 0.41%).
| Demographics | Rating | Rank | Householder Income Ages 45 - 64 years |
| Israelis | 99.9 /100 | #43 | Exceptional $114,186 |
| Bulgarians | 99.9 /100 | #44 | Exceptional $113,883 |
| Immigrants | France | 99.9 /100 | #45 | Exceptional $113,680 |
| Immigrants | Greece | 99.9 /100 | #46 | Exceptional $113,548 |
| Australians | 99.9 /100 | #47 | Exceptional $113,533 |
| Immigrants | Indonesia | 99.9 /100 | #48 | Exceptional $113,519 |
| Immigrants | Russia | 99.8 /100 | #49 | Exceptional $113,215 |
| Immigrants | Austria | 99.8 /100 | #50 | Exceptional $113,140 |
| Immigrants | South Africa | 99.8 /100 | #51 | Exceptional $112,886 |
| Immigrants | Malaysia | 99.8 /100 | #52 | Exceptional $112,796 |
| Afghans | 99.8 /100 | #53 | Exceptional $112,676 |
| Greeks | 99.8 /100 | #54 | Exceptional $112,630 |
| Lithuanians | 99.8 /100 | #55 | Exceptional $112,484 |
| Egyptians | 99.7 /100 | #56 | Exceptional $112,256 |
| Immigrants | Scotland | 99.7 /100 | #57 | Exceptional $112,175 |
| Soviet Union | 99.7 /100 | #58 | Exceptional $112,008 |
| Immigrants | Europe | 99.7 /100 | #59 | Exceptional $111,984 |
| Immigrants | Netherlands | 99.7 /100 | #60 | Exceptional $111,982 |
| Immigrants | Czechoslovakia | 99.7 /100 | #61 | Exceptional $111,914 |
| Immigrants | Norway | 99.7 /100 | #62 | Exceptional $111,669 |
| Mongolians | 99.6 /100 | #63 | Exceptional $111,602 |