Scottish vs Immigrants from France Divorced or Separated
COMPARE
Scottish
Immigrants from France
Divorced or Separated
Divorced or Separated Comparison
Scottish
Immigrants from France
12.6%
DIVORCED OR SEPARATED
0.4/ 100
METRIC RATING
267th/ 347
METRIC RANK
11.7%
DIVORCED OR SEPARATED
96.6/ 100
METRIC RATING
112th/ 347
METRIC RANK
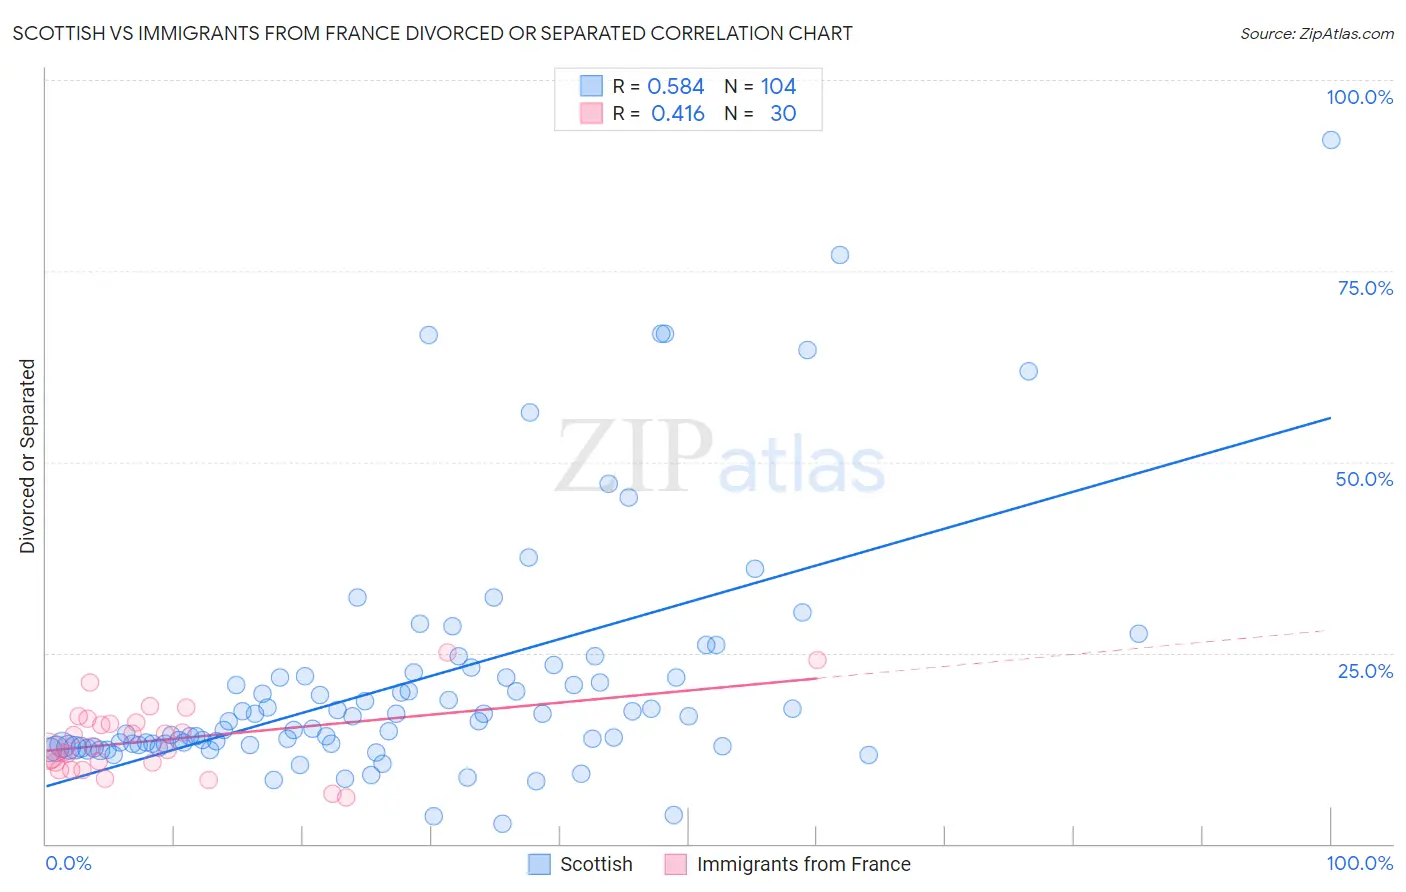
Scottish vs Immigrants from France Divorced or Separated Correlation Chart
The statistical analysis conducted on geographies consisting of 566,665,399 people shows a substantial positive correlation between the proportion of Scottish and percentage of population currently divorced or separated in the United States with a correlation coefficient (R) of 0.584 and weighted average of 12.6%. Similarly, the statistical analysis conducted on geographies consisting of 287,864,701 people shows a moderate positive correlation between the proportion of Immigrants from France and percentage of population currently divorced or separated in the United States with a correlation coefficient (R) of 0.416 and weighted average of 11.7%, a difference of 7.9%.
Divorced or Separated Correlation Summary
| Measurement | Scottish | Immigrants from France |
| Minimum | 2.6% | 6.0% |
| Maximum | 92.2% | 25.0% |
| Range | 89.6% | 19.0% |
| Mean | 21.2% | 13.6% |
| Median | 16.0% | 12.5% |
| Interquartile 25% (IQ1) | 12.8% | 10.7% |
| Interquartile 75% (IQ3) | 21.8% | 15.8% |
| Interquartile Range (IQR) | 9.1% | 5.1% |
| Standard Deviation (Sample) | 16.0% | 4.6% |
| Standard Deviation (Population) | 15.9% | 4.5% |
Similar Demographics by Divorced or Separated
Demographics Similar to Scottish by Divorced or Separated
In terms of divorced or separated, the demographic groups most similar to Scottish are Fijian (12.6%, a difference of 0.010%), Immigrants from Liberia (12.6%, a difference of 0.030%), White/Caucasian (12.6%, a difference of 0.040%), Immigrants from Senegal (12.6%, a difference of 0.050%), and English (12.6%, a difference of 0.070%).
| Demographics | Rating | Rank | Divorced or Separated |
| Immigrants | Uruguay | 0.6 /100 | #260 | Tragic 12.6% |
| Immigrants | Dominica | 0.5 /100 | #261 | Tragic 12.6% |
| Basques | 0.5 /100 | #262 | Tragic 12.6% |
| Immigrants | Panama | 0.5 /100 | #263 | Tragic 12.6% |
| English | 0.5 /100 | #264 | Tragic 12.6% |
| Immigrants | Senegal | 0.5 /100 | #265 | Tragic 12.6% |
| Whites/Caucasians | 0.5 /100 | #266 | Tragic 12.6% |
| Scottish | 0.4 /100 | #267 | Tragic 12.6% |
| Fijians | 0.4 /100 | #268 | Tragic 12.6% |
| Immigrants | Liberia | 0.4 /100 | #269 | Tragic 12.6% |
| Ute | 0.4 /100 | #270 | Tragic 12.6% |
| Panamanians | 0.3 /100 | #271 | Tragic 12.7% |
| Immigrants | Middle Africa | 0.3 /100 | #272 | Tragic 12.7% |
| Immigrants | Micronesia | 0.3 /100 | #273 | Tragic 12.7% |
| Bermudans | 0.3 /100 | #274 | Tragic 12.7% |
Demographics Similar to Immigrants from France by Divorced or Separated
In terms of divorced or separated, the demographic groups most similar to Immigrants from France are Estonian (11.7%, a difference of 0.0%), Immigrants from Spain (11.7%, a difference of 0.050%), Immigrants from South Africa (11.7%, a difference of 0.090%), Immigrants from Czechoslovakia (11.7%, a difference of 0.090%), and Greek (11.7%, a difference of 0.10%).
| Demographics | Rating | Rank | Divorced or Separated |
| Immigrants | El Salvador | 97.9 /100 | #105 | Exceptional 11.7% |
| Immigrants | Kazakhstan | 97.8 /100 | #106 | Exceptional 11.7% |
| Native Hawaiians | 97.2 /100 | #107 | Exceptional 11.7% |
| Greeks | 96.9 /100 | #108 | Exceptional 11.7% |
| Immigrants | South Africa | 96.9 /100 | #109 | Exceptional 11.7% |
| Immigrants | Czechoslovakia | 96.9 /100 | #110 | Exceptional 11.7% |
| Immigrants | Spain | 96.8 /100 | #111 | Exceptional 11.7% |
| Immigrants | France | 96.6 /100 | #112 | Exceptional 11.7% |
| Estonians | 96.6 /100 | #113 | Exceptional 11.7% |
| Immigrants | Norway | 95.9 /100 | #114 | Exceptional 11.7% |
| Lithuanians | 95.7 /100 | #115 | Exceptional 11.7% |
| Immigrants | Iraq | 95.4 /100 | #116 | Exceptional 11.7% |
| Immigrants | Uganda | 95.3 /100 | #117 | Exceptional 11.7% |
| Ecuadorians | 95.3 /100 | #118 | Exceptional 11.7% |
| Syrians | 95.1 /100 | #119 | Exceptional 11.7% |