Scottish vs Arab Householder Income Ages 45 - 64 years
COMPARE
Scottish
Arab
Householder Income Ages 45 - 64 years
Householder Income Ages 45 - 64 years Comparison
Scottish
Arabs
$102,123
HOUSEHOLDER INCOME AGES 45 - 64 YEARS
71.1/ 100
METRIC RATING
162nd/ 347
METRIC RANK
$104,566
HOUSEHOLDER INCOME AGES 45 - 64 YEARS
89.3/ 100
METRIC RATING
133rd/ 347
METRIC RANK
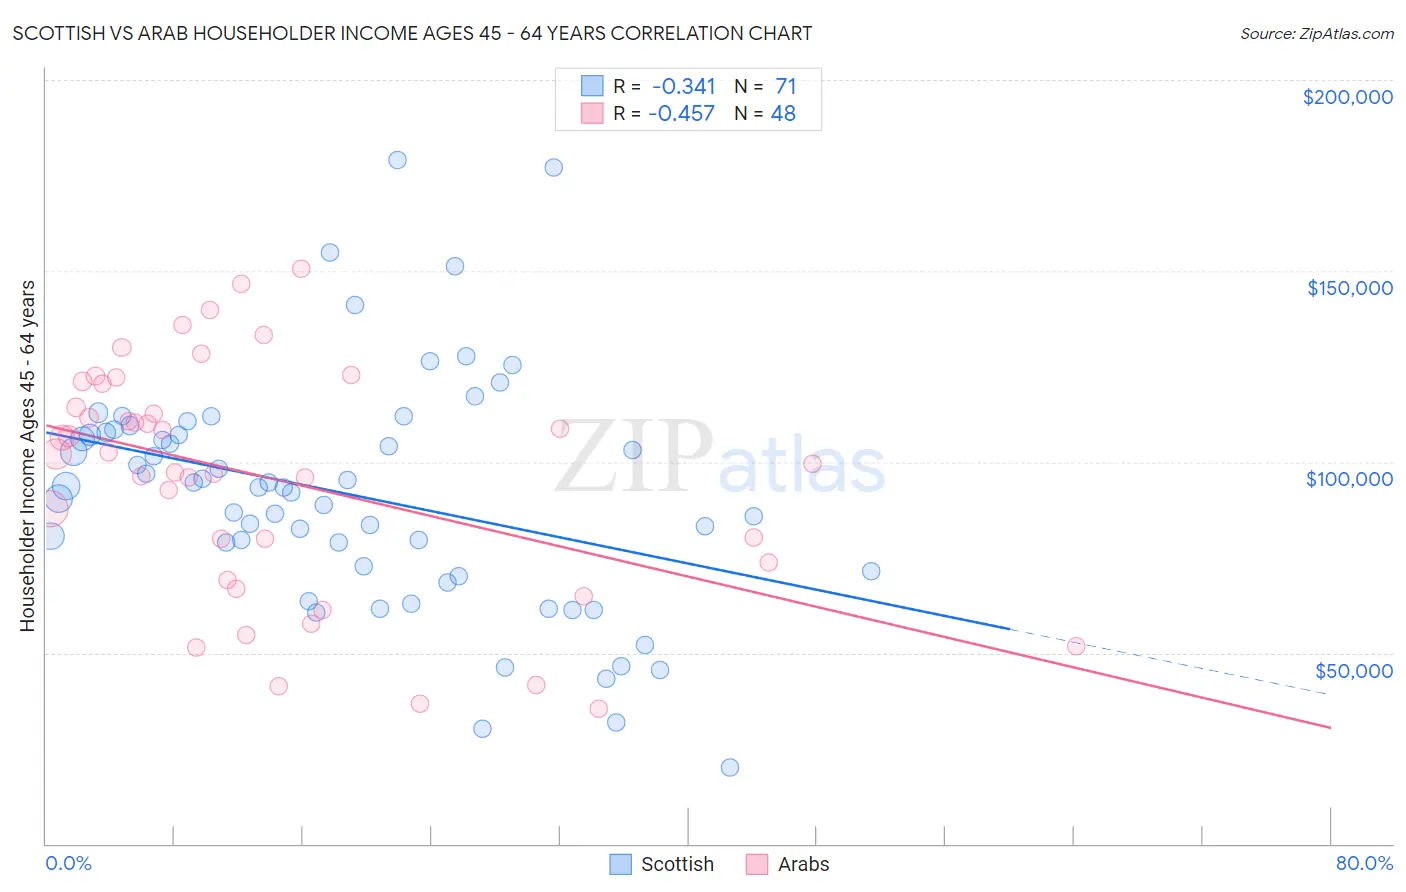
Scottish vs Arab Householder Income Ages 45 - 64 years Correlation Chart
The statistical analysis conducted on geographies consisting of 563,389,205 people shows a mild negative correlation between the proportion of Scottish and household income with householder between the ages 45 and 64 in the United States with a correlation coefficient (R) of -0.341 and weighted average of $102,123. Similarly, the statistical analysis conducted on geographies consisting of 485,614,967 people shows a moderate negative correlation between the proportion of Arabs and household income with householder between the ages 45 and 64 in the United States with a correlation coefficient (R) of -0.457 and weighted average of $104,566, a difference of 2.4%.
Householder Income Ages 45 - 64 years Correlation Summary
| Measurement | Scottish | Arab |
| Minimum | $20,057 | $35,250 |
| Maximum | $179,004 | $150,539 |
| Range | $158,947 | $115,289 |
| Mean | $91,449 | $95,530 |
| Median | $93,434 | $100,868 |
| Interquartile 25% (IQ1) | $71,369 | $71,485 |
| Interquartile 75% (IQ3) | $107,815 | $117,419 |
| Interquartile Range (IQR) | $36,446 | $45,934 |
| Standard Deviation (Sample) | $30,831 | $30,403 |
| Standard Deviation (Population) | $30,613 | $30,085 |
Similar Demographics by Householder Income Ages 45 - 64 years
Demographics Similar to Scottish by Householder Income Ages 45 - 64 years
In terms of householder income ages 45 - 64 years, the demographic groups most similar to Scottish are Immigrants from Nepal ($102,190, a difference of 0.070%), English ($102,021, a difference of 0.10%), Immigrants from Morocco ($102,015, a difference of 0.11%), Icelander ($102,261, a difference of 0.14%), and Immigrants from Albania ($101,957, a difference of 0.16%).
| Demographics | Rating | Rank | Householder Income Ages 45 - 64 years |
| Costa Ricans | 77.4 /100 | #155 | Good $102,779 |
| Carpatho Rusyns | 77.4 /100 | #156 | Good $102,777 |
| Immigrants | Ethiopia | 77.3 /100 | #157 | Good $102,763 |
| Slavs | 76.1 /100 | #158 | Good $102,629 |
| Sierra Leoneans | 74.2 /100 | #159 | Good $102,427 |
| Icelanders | 72.5 /100 | #160 | Good $102,261 |
| Immigrants | Nepal | 71.8 /100 | #161 | Good $102,190 |
| Scottish | 71.1 /100 | #162 | Good $102,123 |
| English | 70.1 /100 | #163 | Good $102,021 |
| Immigrants | Morocco | 70.0 /100 | #164 | Good $102,015 |
| Immigrants | Albania | 69.4 /100 | #165 | Good $101,957 |
| Samoans | 65.3 /100 | #166 | Good $101,580 |
| Czechoslovakians | 63.0 /100 | #167 | Good $101,387 |
| South American Indians | 60.5 /100 | #168 | Good $101,171 |
| Guamanians/Chamorros | 60.5 /100 | #169 | Good $101,170 |
Demographics Similar to Arabs by Householder Income Ages 45 - 64 years
In terms of householder income ages 45 - 64 years, the demographic groups most similar to Arabs are Canadian ($104,560, a difference of 0.010%), Brazilian ($104,408, a difference of 0.15%), Lebanese ($104,734, a difference of 0.16%), Immigrants from Syria ($104,858, a difference of 0.28%), and Taiwanese ($104,180, a difference of 0.37%).
| Demographics | Rating | Rank | Householder Income Ages 45 - 64 years |
| Portuguese | 92.4 /100 | #126 | Exceptional $105,309 |
| Immigrants | Saudi Arabia | 92.2 /100 | #127 | Exceptional $105,249 |
| Native Hawaiians | 91.8 /100 | #128 | Exceptional $105,149 |
| Peruvians | 91.5 /100 | #129 | Exceptional $105,070 |
| Immigrants | Zimbabwe | 91.2 /100 | #130 | Exceptional $104,992 |
| Immigrants | Syria | 90.7 /100 | #131 | Exceptional $104,858 |
| Lebanese | 90.1 /100 | #132 | Exceptional $104,734 |
| Arabs | 89.3 /100 | #133 | Excellent $104,566 |
| Canadians | 89.3 /100 | #134 | Excellent $104,560 |
| Brazilians | 88.6 /100 | #135 | Excellent $104,408 |
| Taiwanese | 87.4 /100 | #136 | Excellent $104,180 |
| Hungarians | 85.8 /100 | #137 | Excellent $103,913 |
| Ethiopians | 84.7 /100 | #138 | Excellent $103,736 |
| Immigrants | Oceania | 84.5 /100 | #139 | Excellent $103,705 |
| Norwegians | 84.3 /100 | #140 | Excellent $103,682 |