Scottish vs Egyptian Householder Income Ages 45 - 64 years
COMPARE
Scottish
Egyptian
Householder Income Ages 45 - 64 years
Householder Income Ages 45 - 64 years Comparison
Scottish
Egyptians
$102,123
HOUSEHOLDER INCOME AGES 45 - 64 YEARS
71.1/ 100
METRIC RATING
162nd/ 347
METRIC RANK
$112,256
HOUSEHOLDER INCOME AGES 45 - 64 YEARS
99.7/ 100
METRIC RATING
56th/ 347
METRIC RANK
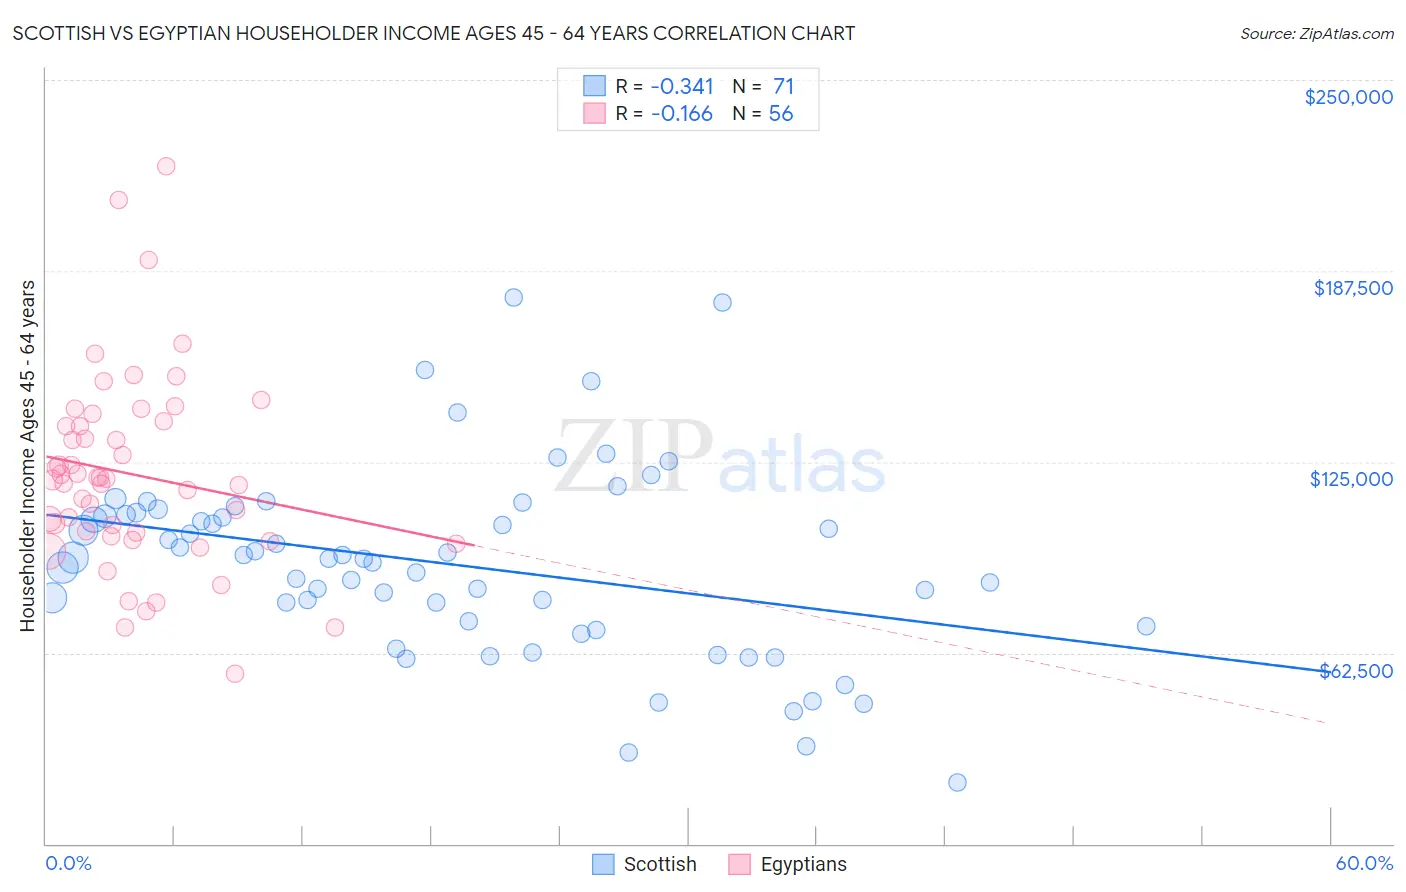
Scottish vs Egyptian Householder Income Ages 45 - 64 years Correlation Chart
The statistical analysis conducted on geographies consisting of 563,389,205 people shows a mild negative correlation between the proportion of Scottish and household income with householder between the ages 45 and 64 in the United States with a correlation coefficient (R) of -0.341 and weighted average of $102,123. Similarly, the statistical analysis conducted on geographies consisting of 276,614,295 people shows a poor negative correlation between the proportion of Egyptians and household income with householder between the ages 45 and 64 in the United States with a correlation coefficient (R) of -0.166 and weighted average of $112,256, a difference of 9.9%.
Householder Income Ages 45 - 64 years Correlation Summary
| Measurement | Scottish | Egyptian |
| Minimum | $20,057 | $55,625 |
| Maximum | $179,004 | $221,912 |
| Range | $158,947 | $166,287 |
| Mean | $91,449 | $120,908 |
| Median | $93,434 | $119,250 |
| Interquartile 25% (IQ1) | $71,369 | $101,192 |
| Interquartile 75% (IQ3) | $107,815 | $137,363 |
| Interquartile Range (IQR) | $36,446 | $36,171 |
| Standard Deviation (Sample) | $30,831 | $31,748 |
| Standard Deviation (Population) | $30,613 | $31,463 |
Similar Demographics by Householder Income Ages 45 - 64 years
Demographics Similar to Scottish by Householder Income Ages 45 - 64 years
In terms of householder income ages 45 - 64 years, the demographic groups most similar to Scottish are Immigrants from Nepal ($102,190, a difference of 0.070%), English ($102,021, a difference of 0.10%), Immigrants from Morocco ($102,015, a difference of 0.11%), Icelander ($102,261, a difference of 0.14%), and Immigrants from Albania ($101,957, a difference of 0.16%).
| Demographics | Rating | Rank | Householder Income Ages 45 - 64 years |
| Costa Ricans | 77.4 /100 | #155 | Good $102,779 |
| Carpatho Rusyns | 77.4 /100 | #156 | Good $102,777 |
| Immigrants | Ethiopia | 77.3 /100 | #157 | Good $102,763 |
| Slavs | 76.1 /100 | #158 | Good $102,629 |
| Sierra Leoneans | 74.2 /100 | #159 | Good $102,427 |
| Icelanders | 72.5 /100 | #160 | Good $102,261 |
| Immigrants | Nepal | 71.8 /100 | #161 | Good $102,190 |
| Scottish | 71.1 /100 | #162 | Good $102,123 |
| English | 70.1 /100 | #163 | Good $102,021 |
| Immigrants | Morocco | 70.0 /100 | #164 | Good $102,015 |
| Immigrants | Albania | 69.4 /100 | #165 | Good $101,957 |
| Samoans | 65.3 /100 | #166 | Good $101,580 |
| Czechoslovakians | 63.0 /100 | #167 | Good $101,387 |
| South American Indians | 60.5 /100 | #168 | Good $101,171 |
| Guamanians/Chamorros | 60.5 /100 | #169 | Good $101,170 |
Demographics Similar to Egyptians by Householder Income Ages 45 - 64 years
In terms of householder income ages 45 - 64 years, the demographic groups most similar to Egyptians are Immigrants from Scotland ($112,175, a difference of 0.070%), Lithuanian ($112,484, a difference of 0.20%), Soviet Union ($112,008, a difference of 0.22%), Immigrants from Europe ($111,984, a difference of 0.24%), and Immigrants from Netherlands ($111,982, a difference of 0.24%).
| Demographics | Rating | Rank | Householder Income Ages 45 - 64 years |
| Immigrants | Russia | 99.8 /100 | #49 | Exceptional $113,215 |
| Immigrants | Austria | 99.8 /100 | #50 | Exceptional $113,140 |
| Immigrants | South Africa | 99.8 /100 | #51 | Exceptional $112,886 |
| Immigrants | Malaysia | 99.8 /100 | #52 | Exceptional $112,796 |
| Afghans | 99.8 /100 | #53 | Exceptional $112,676 |
| Greeks | 99.8 /100 | #54 | Exceptional $112,630 |
| Lithuanians | 99.8 /100 | #55 | Exceptional $112,484 |
| Egyptians | 99.7 /100 | #56 | Exceptional $112,256 |
| Immigrants | Scotland | 99.7 /100 | #57 | Exceptional $112,175 |
| Soviet Union | 99.7 /100 | #58 | Exceptional $112,008 |
| Immigrants | Europe | 99.7 /100 | #59 | Exceptional $111,984 |
| Immigrants | Netherlands | 99.7 /100 | #60 | Exceptional $111,982 |
| Immigrants | Czechoslovakia | 99.7 /100 | #61 | Exceptional $111,914 |
| Immigrants | Norway | 99.7 /100 | #62 | Exceptional $111,669 |
| Mongolians | 99.6 /100 | #63 | Exceptional $111,602 |