Immigrants from China vs Thai Median Male Earnings
COMPARE
Immigrants from China
Thai
Median Male Earnings
Median Male Earnings Comparison
Immigrants from China
Thais
$67,353
MEDIAN MALE EARNINGS
100.0/ 100
METRIC RATING
13th/ 347
METRIC RANK
$72,135
MEDIAN MALE EARNINGS
100.0/ 100
METRIC RATING
4th/ 347
METRIC RANK
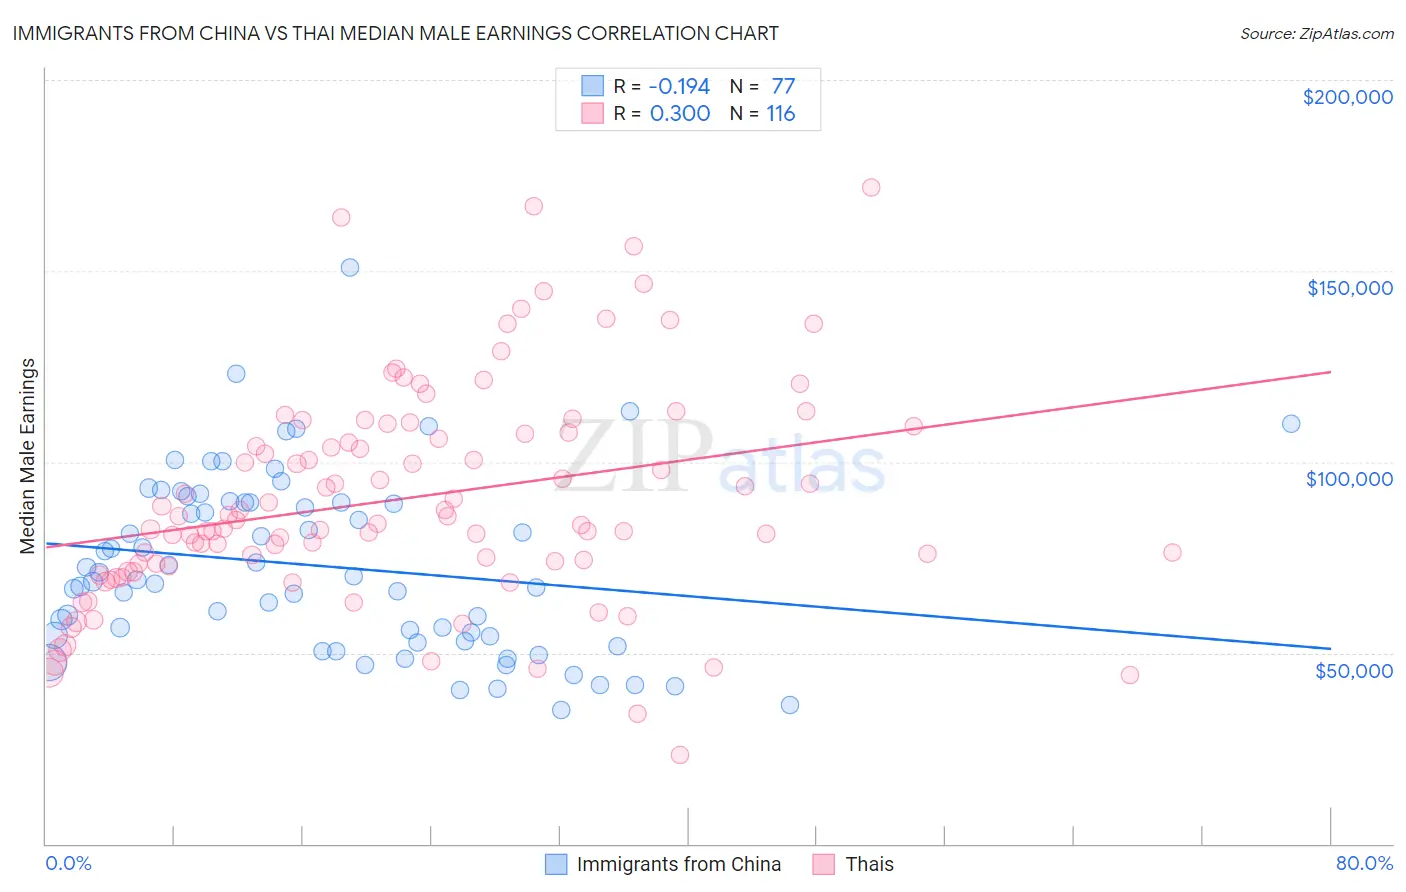
Immigrants from China vs Thai Median Male Earnings Correlation Chart
The statistical analysis conducted on geographies consisting of 456,906,248 people shows a poor negative correlation between the proportion of Immigrants from China and median male earnings in the United States with a correlation coefficient (R) of -0.194 and weighted average of $67,353. Similarly, the statistical analysis conducted on geographies consisting of 475,691,954 people shows a weak positive correlation between the proportion of Thais and median male earnings in the United States with a correlation coefficient (R) of 0.300 and weighted average of $72,135, a difference of 7.1%.
Median Male Earnings Correlation Summary
| Measurement | Immigrants from China | Thai |
| Minimum | $35,000 | $23,362 |
| Maximum | $150,740 | $171,875 |
| Range | $115,740 | $148,513 |
| Mean | $72,671 | $90,264 |
| Median | $69,216 | $84,301 |
| Interquartile 25% (IQ1) | $53,825 | $73,018 |
| Interquartile 75% (IQ3) | $89,334 | $107,587 |
| Interquartile Range (IQR) | $35,509 | $34,569 |
| Standard Deviation (Sample) | $23,135 | $28,453 |
| Standard Deviation (Population) | $22,985 | $28,330 |
Demographics Similar to Immigrants from China and Thais by Median Male Earnings
In terms of median male earnings, the demographic groups most similar to Immigrants from China are Okinawan ($67,232, a difference of 0.18%), Immigrants from Australia ($67,634, a difference of 0.42%), Immigrants from Ireland ($67,698, a difference of 0.51%), Immigrants from Eastern Asia ($66,903, a difference of 0.67%), and Eastern European ($66,472, a difference of 1.3%). Similarly, the demographic groups most similar to Thais are Immigrants from Singapore ($71,348, a difference of 1.1%), Iranian ($70,648, a difference of 2.1%), Immigrants from Taiwan ($74,031, a difference of 2.6%), Immigrants from Hong Kong ($70,146, a difference of 2.8%), and Immigrants from India ($74,207, a difference of 2.9%).
| Demographics | Rating | Rank | Median Male Earnings |
| Filipinos | 100.0 /100 | #1 | Exceptional $74,224 |
| Immigrants | India | 100.0 /100 | #2 | Exceptional $74,207 |
| Immigrants | Taiwan | 100.0 /100 | #3 | Exceptional $74,031 |
| Thais | 100.0 /100 | #4 | Exceptional $72,135 |
| Immigrants | Singapore | 100.0 /100 | #5 | Exceptional $71,348 |
| Iranians | 100.0 /100 | #6 | Exceptional $70,648 |
| Immigrants | Hong Kong | 100.0 /100 | #7 | Exceptional $70,146 |
| Immigrants | Iran | 100.0 /100 | #8 | Exceptional $69,284 |
| Immigrants | South Central Asia | 100.0 /100 | #9 | Exceptional $68,960 |
| Immigrants | Israel | 100.0 /100 | #10 | Exceptional $68,716 |
| Immigrants | Ireland | 100.0 /100 | #11 | Exceptional $67,698 |
| Immigrants | Australia | 100.0 /100 | #12 | Exceptional $67,634 |
| Immigrants | China | 100.0 /100 | #13 | Exceptional $67,353 |
| Okinawans | 100.0 /100 | #14 | Exceptional $67,232 |
| Immigrants | Eastern Asia | 100.0 /100 | #15 | Exceptional $66,903 |
| Eastern Europeans | 100.0 /100 | #16 | Exceptional $66,472 |
| Immigrants | Belgium | 100.0 /100 | #17 | Exceptional $66,125 |
| Indians (Asian) | 100.0 /100 | #18 | Exceptional $66,078 |
| Cypriots | 100.0 /100 | #19 | Exceptional $65,549 |
| Immigrants | Japan | 100.0 /100 | #20 | Exceptional $65,518 |