French vs Thai Median Male Earnings
COMPARE
French
Thai
Median Male Earnings
Median Male Earnings Comparison
French
Thais
$55,350
MEDIAN MALE EARNINGS
69.9/ 100
METRIC RATING
162nd/ 347
METRIC RANK
$72,135
MEDIAN MALE EARNINGS
100.0/ 100
METRIC RATING
4th/ 347
METRIC RANK
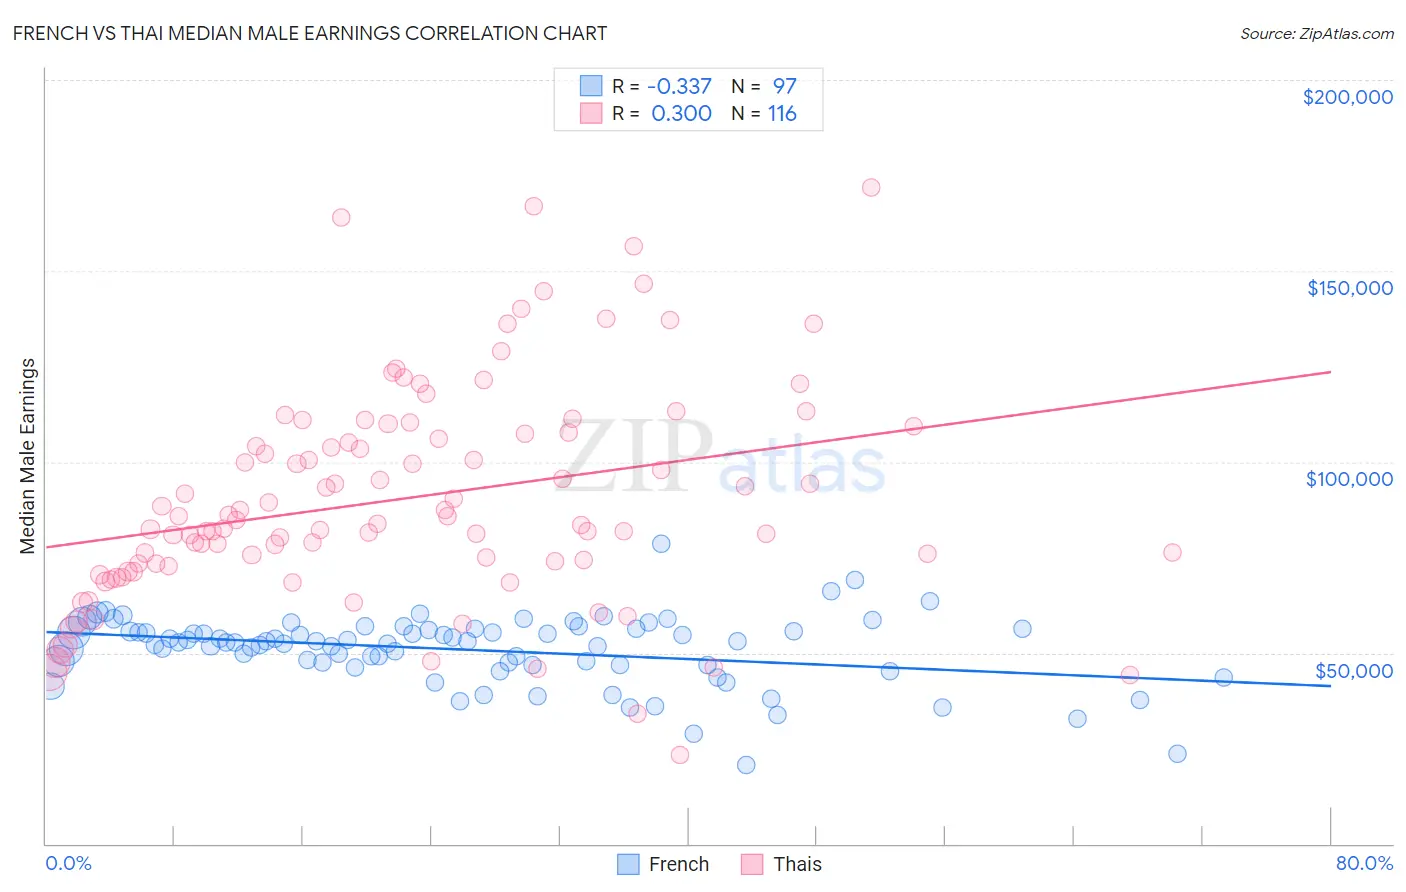
French vs Thai Median Male Earnings Correlation Chart
The statistical analysis conducted on geographies consisting of 571,095,815 people shows a mild negative correlation between the proportion of French and median male earnings in the United States with a correlation coefficient (R) of -0.337 and weighted average of $55,350. Similarly, the statistical analysis conducted on geographies consisting of 475,691,954 people shows a weak positive correlation between the proportion of Thais and median male earnings in the United States with a correlation coefficient (R) of 0.300 and weighted average of $72,135, a difference of 30.3%.
Median Male Earnings Correlation Summary
| Measurement | French | Thai |
| Minimum | $20,556 | $23,362 |
| Maximum | $78,663 | $171,875 |
| Range | $58,107 | $148,513 |
| Mean | $50,816 | $90,264 |
| Median | $52,806 | $84,301 |
| Interquartile 25% (IQ1) | $46,933 | $73,018 |
| Interquartile 75% (IQ3) | $56,096 | $107,587 |
| Interquartile Range (IQR) | $9,162 | $34,569 |
| Standard Deviation (Sample) | $9,122 | $28,453 |
| Standard Deviation (Population) | $9,075 | $28,330 |
Similar Demographics by Median Male Earnings
Demographics Similar to French by Median Male Earnings
In terms of median male earnings, the demographic groups most similar to French are Belgian ($55,361, a difference of 0.020%), Basque ($55,370, a difference of 0.040%), Alsatian ($55,380, a difference of 0.050%), Czechoslovakian ($55,382, a difference of 0.060%), and Ugandan ($55,290, a difference of 0.11%).
| Demographics | Rating | Rank | Median Male Earnings |
| Scandinavians | 73.4 /100 | #155 | Good $55,527 |
| Immigrants | Ethiopia | 71.6 /100 | #156 | Good $55,434 |
| Icelanders | 71.2 /100 | #157 | Good $55,415 |
| Czechoslovakians | 70.5 /100 | #158 | Good $55,382 |
| Alsatians | 70.5 /100 | #159 | Good $55,380 |
| Basques | 70.3 /100 | #160 | Good $55,370 |
| Belgians | 70.1 /100 | #161 | Good $55,361 |
| French | 69.9 /100 | #162 | Good $55,350 |
| Ugandans | 68.6 /100 | #163 | Good $55,290 |
| Immigrants | South Eastern Asia | 67.6 /100 | #164 | Good $55,241 |
| Immigrants | Portugal | 66.3 /100 | #165 | Good $55,182 |
| Germans | 61.6 /100 | #166 | Good $54,974 |
| Immigrants | Fiji | 61.2 /100 | #167 | Good $54,958 |
| Immigrants | Vietnam | 60.2 /100 | #168 | Good $54,913 |
| French Canadians | 55.6 /100 | #169 | Average $54,722 |
Demographics Similar to Thais by Median Male Earnings
In terms of median male earnings, the demographic groups most similar to Thais are Immigrants from Singapore ($71,348, a difference of 1.1%), Iranian ($70,648, a difference of 2.1%), Immigrants from Taiwan ($74,031, a difference of 2.6%), Immigrants from Hong Kong ($70,146, a difference of 2.8%), and Immigrants from India ($74,207, a difference of 2.9%).
| Demographics | Rating | Rank | Median Male Earnings |
| Filipinos | 100.0 /100 | #1 | Exceptional $74,224 |
| Immigrants | India | 100.0 /100 | #2 | Exceptional $74,207 |
| Immigrants | Taiwan | 100.0 /100 | #3 | Exceptional $74,031 |
| Thais | 100.0 /100 | #4 | Exceptional $72,135 |
| Immigrants | Singapore | 100.0 /100 | #5 | Exceptional $71,348 |
| Iranians | 100.0 /100 | #6 | Exceptional $70,648 |
| Immigrants | Hong Kong | 100.0 /100 | #7 | Exceptional $70,146 |
| Immigrants | Iran | 100.0 /100 | #8 | Exceptional $69,284 |
| Immigrants | South Central Asia | 100.0 /100 | #9 | Exceptional $68,960 |
| Immigrants | Israel | 100.0 /100 | #10 | Exceptional $68,716 |
| Immigrants | Ireland | 100.0 /100 | #11 | Exceptional $67,698 |
| Immigrants | Australia | 100.0 /100 | #12 | Exceptional $67,634 |
| Immigrants | China | 100.0 /100 | #13 | Exceptional $67,353 |
| Okinawans | 100.0 /100 | #14 | Exceptional $67,232 |
| Immigrants | Eastern Asia | 100.0 /100 | #15 | Exceptional $66,903 |