Scandinavian vs Immigrants from Eritrea Householder Income Ages 45 - 64 years
COMPARE
Scandinavian
Immigrants from Eritrea
Householder Income Ages 45 - 64 years
Householder Income Ages 45 - 64 years Comparison
Scandinavians
Immigrants from Eritrea
$102,969
HOUSEHOLDER INCOME AGES 45 - 64 YEARS
79.0/ 100
METRIC RATING
153rd/ 347
METRIC RANK
$97,373
HOUSEHOLDER INCOME AGES 45 - 64 YEARS
18.6/ 100
METRIC RATING
204th/ 347
METRIC RANK
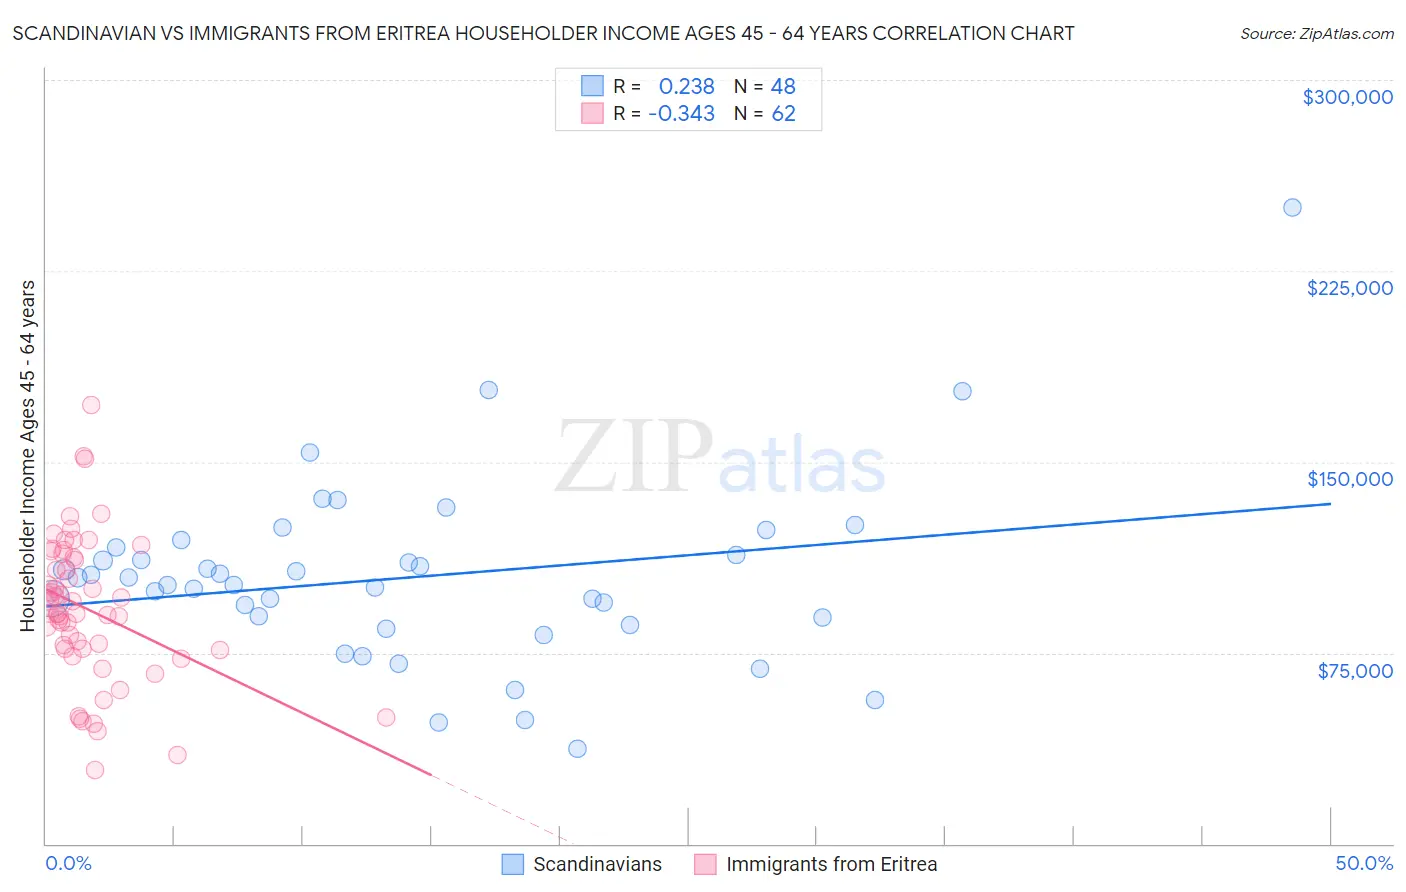
Scandinavian vs Immigrants from Eritrea Householder Income Ages 45 - 64 years Correlation Chart
The statistical analysis conducted on geographies consisting of 471,257,536 people shows a weak positive correlation between the proportion of Scandinavians and household income with householder between the ages 45 and 64 in the United States with a correlation coefficient (R) of 0.238 and weighted average of $102,969. Similarly, the statistical analysis conducted on geographies consisting of 104,839,257 people shows a mild negative correlation between the proportion of Immigrants from Eritrea and household income with householder between the ages 45 and 64 in the United States with a correlation coefficient (R) of -0.343 and weighted average of $97,373, a difference of 5.8%.
Householder Income Ages 45 - 64 years Correlation Summary
| Measurement | Scandinavian | Immigrants from Eritrea |
| Minimum | $37,396 | $28,839 |
| Maximum | $250,001 | $172,216 |
| Range | $212,605 | $143,377 |
| Mean | $104,566 | $92,178 |
| Median | $103,110 | $90,363 |
| Interquartile 25% (IQ1) | $87,340 | $76,571 |
| Interquartile 75% (IQ3) | $114,988 | $112,271 |
| Interquartile Range (IQR) | $27,648 | $35,701 |
| Standard Deviation (Sample) | $35,851 | $28,505 |
| Standard Deviation (Population) | $35,476 | $28,274 |
Similar Demographics by Householder Income Ages 45 - 64 years
Demographics Similar to Scandinavians by Householder Income Ages 45 - 64 years
In terms of householder income ages 45 - 64 years, the demographic groups most similar to Scandinavians are Slovene ($102,885, a difference of 0.080%), Irish ($103,067, a difference of 0.090%), Swiss ($103,071, a difference of 0.10%), Costa Rican ($102,779, a difference of 0.19%), and Carpatho Rusyn ($102,777, a difference of 0.19%).
| Demographics | Rating | Rank | Householder Income Ages 45 - 64 years |
| Immigrants | Chile | 82.5 /100 | #146 | Excellent $103,412 |
| Basques | 82.3 /100 | #147 | Excellent $103,387 |
| Immigrants | Germany | 81.5 /100 | #148 | Excellent $103,282 |
| Immigrants | Sierra Leone | 81.1 /100 | #149 | Excellent $103,227 |
| Immigrants | Peru | 80.7 /100 | #150 | Excellent $103,173 |
| Swiss | 79.9 /100 | #151 | Good $103,071 |
| Irish | 79.8 /100 | #152 | Good $103,067 |
| Scandinavians | 79.0 /100 | #153 | Good $102,969 |
| Slovenes | 78.3 /100 | #154 | Good $102,885 |
| Costa Ricans | 77.4 /100 | #155 | Good $102,779 |
| Carpatho Rusyns | 77.4 /100 | #156 | Good $102,777 |
| Immigrants | Ethiopia | 77.3 /100 | #157 | Good $102,763 |
| Slavs | 76.1 /100 | #158 | Good $102,629 |
| Sierra Leoneans | 74.2 /100 | #159 | Good $102,427 |
| Icelanders | 72.5 /100 | #160 | Good $102,261 |
Demographics Similar to Immigrants from Eritrea by Householder Income Ages 45 - 64 years
In terms of householder income ages 45 - 64 years, the demographic groups most similar to Immigrants from Eritrea are Immigrants from Thailand ($97,400, a difference of 0.030%), Tlingit-Haida ($97,417, a difference of 0.040%), Immigrants from Colombia ($97,290, a difference of 0.090%), Immigrants from Africa ($97,284, a difference of 0.090%), and Ghanaian ($97,277, a difference of 0.10%).
| Demographics | Rating | Rank | Householder Income Ages 45 - 64 years |
| Puget Sound Salish | 27.0 /100 | #197 | Fair $98,340 |
| Immigrants | Iraq | 25.7 /100 | #198 | Fair $98,201 |
| Whites/Caucasians | 24.6 /100 | #199 | Fair $98,091 |
| Immigrants | Kenya | 23.5 /100 | #200 | Fair $97,964 |
| Yugoslavians | 20.0 /100 | #201 | Fair $97,558 |
| Tlingit-Haida | 18.9 /100 | #202 | Poor $97,417 |
| Immigrants | Thailand | 18.8 /100 | #203 | Poor $97,400 |
| Immigrants | Eritrea | 18.6 /100 | #204 | Poor $97,373 |
| Immigrants | Colombia | 18.0 /100 | #205 | Poor $97,290 |
| Immigrants | Africa | 17.9 /100 | #206 | Poor $97,284 |
| Ghanaians | 17.9 /100 | #207 | Poor $97,277 |
| Scotch-Irish | 16.4 /100 | #208 | Poor $97,073 |
| Japanese | 14.8 /100 | #209 | Poor $96,834 |
| Tsimshian | 14.5 /100 | #210 | Poor $96,783 |
| Immigrants | Cambodia | 13.0 /100 | #211 | Poor $96,537 |