U.S. Virgin Islander vs Immigrants from Nigeria Householder Income Ages 45 - 64 years
COMPARE
U.S. Virgin Islander
Immigrants from Nigeria
Householder Income Ages 45 - 64 years
Householder Income Ages 45 - 64 years Comparison
U.S. Virgin Islanders
Immigrants from Nigeria
$82,736
HOUSEHOLDER INCOME AGES 45 - 64 YEARS
0.0/ 100
METRIC RATING
313th/ 347
METRIC RANK
$94,804
HOUSEHOLDER INCOME AGES 45 - 64 YEARS
5.9/ 100
METRIC RATING
221st/ 347
METRIC RANK
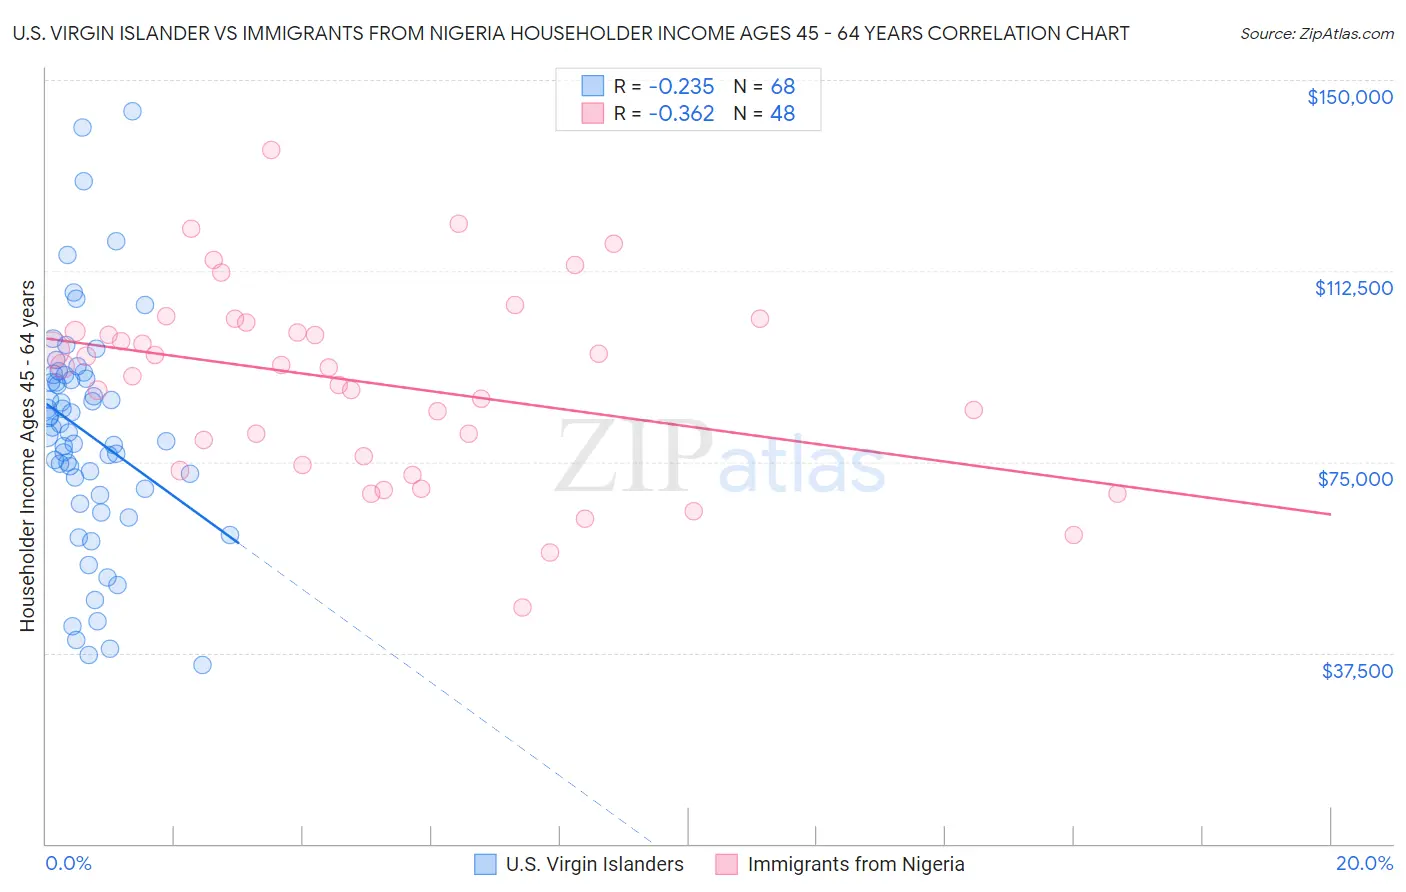
U.S. Virgin Islander vs Immigrants from Nigeria Householder Income Ages 45 - 64 years Correlation Chart
The statistical analysis conducted on geographies consisting of 87,479,620 people shows a weak negative correlation between the proportion of U.S. Virgin Islanders and household income with householder between the ages 45 and 64 in the United States with a correlation coefficient (R) of -0.235 and weighted average of $82,736. Similarly, the statistical analysis conducted on geographies consisting of 283,069,423 people shows a mild negative correlation between the proportion of Immigrants from Nigeria and household income with householder between the ages 45 and 64 in the United States with a correlation coefficient (R) of -0.362 and weighted average of $94,804, a difference of 14.6%.
Householder Income Ages 45 - 64 years Correlation Summary
| Measurement | U.S. Virgin Islander | Immigrants from Nigeria |
| Minimum | $35,018 | $46,429 |
| Maximum | $143,798 | $136,191 |
| Range | $108,780 | $89,762 |
| Mean | $80,559 | $90,499 |
| Median | $81,314 | $93,669 |
| Interquartile 25% (IQ1) | $69,189 | $75,303 |
| Interquartile 75% (IQ3) | $91,656 | $101,492 |
| Interquartile Range (IQR) | $22,467 | $26,189 |
| Standard Deviation (Sample) | $22,451 | $18,699 |
| Standard Deviation (Population) | $22,285 | $18,504 |
Similar Demographics by Householder Income Ages 45 - 64 years
Demographics Similar to U.S. Virgin Islanders by Householder Income Ages 45 - 64 years
In terms of householder income ages 45 - 64 years, the demographic groups most similar to U.S. Virgin Islanders are Immigrants from Honduras ($82,697, a difference of 0.050%), Paiute ($82,629, a difference of 0.13%), Immigrants from Caribbean ($82,513, a difference of 0.27%), Colville ($82,474, a difference of 0.32%), and Cajun ($83,015, a difference of 0.34%).
| Demographics | Rating | Rank | Householder Income Ages 45 - 64 years |
| Ute | 0.0 /100 | #306 | Tragic $83,937 |
| Shoshone | 0.0 /100 | #307 | Tragic $83,588 |
| Immigrants | Cabo Verde | 0.0 /100 | #308 | Tragic $83,542 |
| Immigrants | Dominica | 0.0 /100 | #309 | Tragic $83,311 |
| Immigrants | Haiti | 0.0 /100 | #310 | Tragic $83,257 |
| Immigrants | Bahamas | 0.0 /100 | #311 | Tragic $83,177 |
| Cajuns | 0.0 /100 | #312 | Tragic $83,015 |
| U.S. Virgin Islanders | 0.0 /100 | #313 | Tragic $82,736 |
| Immigrants | Honduras | 0.0 /100 | #314 | Tragic $82,697 |
| Paiute | 0.0 /100 | #315 | Tragic $82,629 |
| Immigrants | Caribbean | 0.0 /100 | #316 | Tragic $82,513 |
| Colville | 0.0 /100 | #317 | Tragic $82,474 |
| Choctaw | 0.0 /100 | #318 | Tragic $82,287 |
| Chickasaw | 0.0 /100 | #319 | Tragic $82,193 |
| Apache | 0.0 /100 | #320 | Tragic $82,184 |
Demographics Similar to Immigrants from Nigeria by Householder Income Ages 45 - 64 years
In terms of householder income ages 45 - 64 years, the demographic groups most similar to Immigrants from Nigeria are Salvadoran ($94,842, a difference of 0.040%), Immigrants from Armenia ($94,863, a difference of 0.060%), Delaware ($94,914, a difference of 0.12%), Immigrants from Ghana ($94,982, a difference of 0.19%), and Malaysian ($94,517, a difference of 0.30%).
| Demographics | Rating | Rank | Householder Income Ages 45 - 64 years |
| Panamanians | 10.6 /100 | #214 | Poor $96,066 |
| Nigerians | 8.2 /100 | #215 | Tragic $95,492 |
| Immigrants | Venezuela | 7.6 /100 | #216 | Tragic $95,342 |
| Immigrants | Ghana | 6.4 /100 | #217 | Tragic $94,982 |
| Delaware | 6.2 /100 | #218 | Tragic $94,914 |
| Immigrants | Armenia | 6.1 /100 | #219 | Tragic $94,863 |
| Salvadorans | 6.0 /100 | #220 | Tragic $94,842 |
| Immigrants | Nigeria | 5.9 /100 | #221 | Tragic $94,804 |
| Malaysians | 5.2 /100 | #222 | Tragic $94,517 |
| Immigrants | Nonimmigrants | 5.0 /100 | #223 | Tragic $94,448 |
| Immigrants | Bosnia and Herzegovina | 4.6 /100 | #224 | Tragic $94,288 |
| Bermudans | 4.4 /100 | #225 | Tragic $94,197 |
| Immigrants | Azores | 4.3 /100 | #226 | Tragic $94,138 |
| Alaska Natives | 4.0 /100 | #227 | Tragic $93,991 |
| Immigrants | Panama | 3.7 /100 | #228 | Tragic $93,815 |