Scandinavian vs Palestinian Householder Income Ages 45 - 64 years
COMPARE
Scandinavian
Palestinian
Householder Income Ages 45 - 64 years
Householder Income Ages 45 - 64 years Comparison
Scandinavians
Palestinians
$102,969
HOUSEHOLDER INCOME AGES 45 - 64 YEARS
79.0/ 100
METRIC RATING
153rd/ 347
METRIC RANK
$107,721
HOUSEHOLDER INCOME AGES 45 - 64 YEARS
97.6/ 100
METRIC RATING
99th/ 347
METRIC RANK
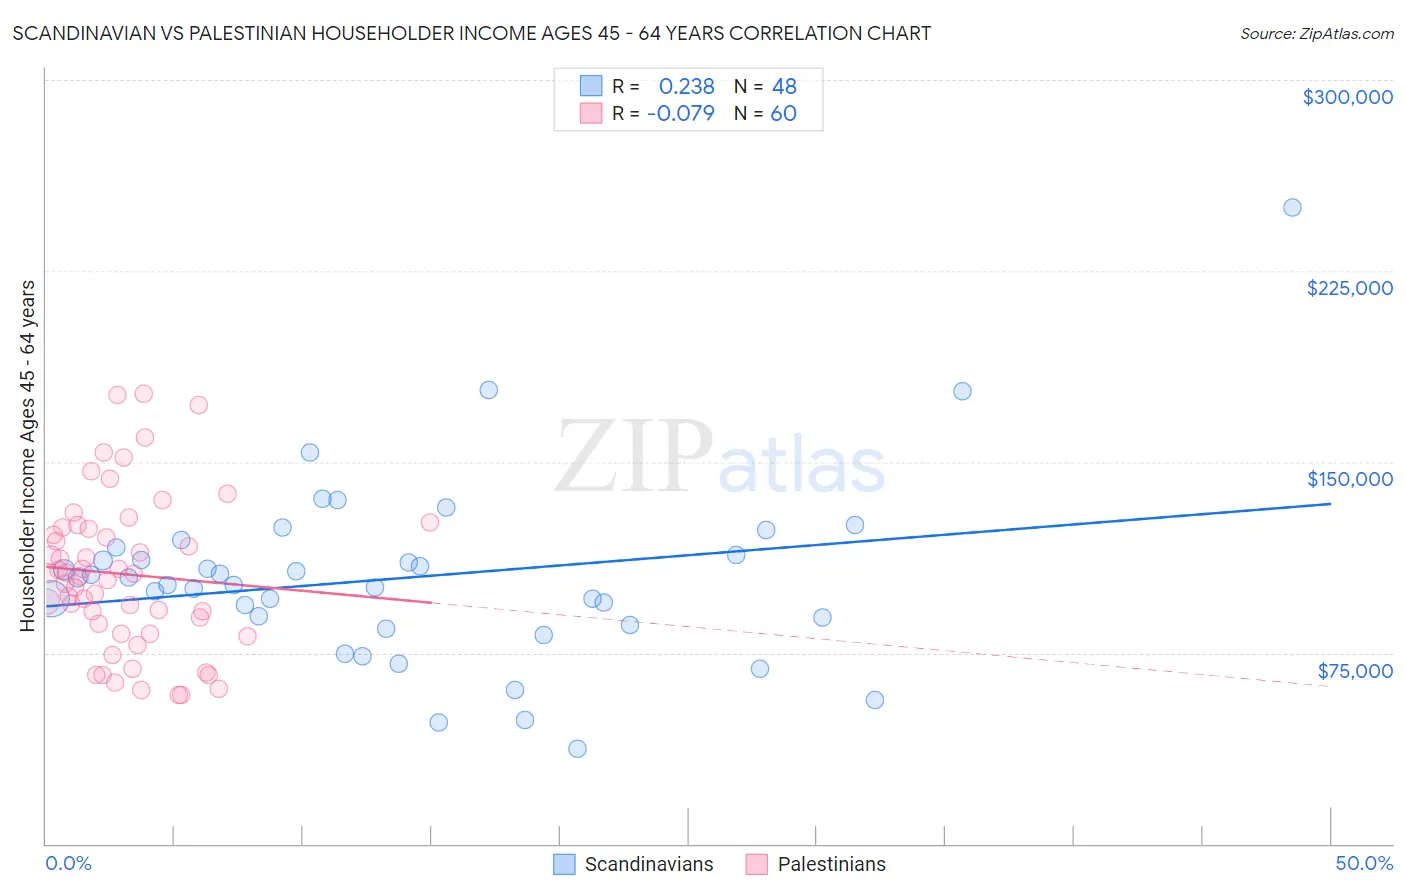
Scandinavian vs Palestinian Householder Income Ages 45 - 64 years Correlation Chart
The statistical analysis conducted on geographies consisting of 471,257,536 people shows a weak positive correlation between the proportion of Scandinavians and household income with householder between the ages 45 and 64 in the United States with a correlation coefficient (R) of 0.238 and weighted average of $102,969. Similarly, the statistical analysis conducted on geographies consisting of 216,304,002 people shows a slight negative correlation between the proportion of Palestinians and household income with householder between the ages 45 and 64 in the United States with a correlation coefficient (R) of -0.079 and weighted average of $107,721, a difference of 4.6%.
Householder Income Ages 45 - 64 years Correlation Summary
| Measurement | Scandinavian | Palestinian |
| Minimum | $37,396 | $58,671 |
| Maximum | $250,001 | $176,545 |
| Range | $212,605 | $117,874 |
| Mean | $104,566 | $105,880 |
| Median | $103,110 | $105,547 |
| Interquartile 25% (IQ1) | $87,340 | $84,446 |
| Interquartile 75% (IQ3) | $114,988 | $123,759 |
| Interquartile Range (IQR) | $27,648 | $39,313 |
| Standard Deviation (Sample) | $35,851 | $30,088 |
| Standard Deviation (Population) | $35,476 | $29,836 |
Similar Demographics by Householder Income Ages 45 - 64 years
Demographics Similar to Scandinavians by Householder Income Ages 45 - 64 years
In terms of householder income ages 45 - 64 years, the demographic groups most similar to Scandinavians are Slovene ($102,885, a difference of 0.080%), Irish ($103,067, a difference of 0.090%), Swiss ($103,071, a difference of 0.10%), Costa Rican ($102,779, a difference of 0.19%), and Carpatho Rusyn ($102,777, a difference of 0.19%).
| Demographics | Rating | Rank | Householder Income Ages 45 - 64 years |
| Immigrants | Chile | 82.5 /100 | #146 | Excellent $103,412 |
| Basques | 82.3 /100 | #147 | Excellent $103,387 |
| Immigrants | Germany | 81.5 /100 | #148 | Excellent $103,282 |
| Immigrants | Sierra Leone | 81.1 /100 | #149 | Excellent $103,227 |
| Immigrants | Peru | 80.7 /100 | #150 | Excellent $103,173 |
| Swiss | 79.9 /100 | #151 | Good $103,071 |
| Irish | 79.8 /100 | #152 | Good $103,067 |
| Scandinavians | 79.0 /100 | #153 | Good $102,969 |
| Slovenes | 78.3 /100 | #154 | Good $102,885 |
| Costa Ricans | 77.4 /100 | #155 | Good $102,779 |
| Carpatho Rusyns | 77.4 /100 | #156 | Good $102,777 |
| Immigrants | Ethiopia | 77.3 /100 | #157 | Good $102,763 |
| Slavs | 76.1 /100 | #158 | Good $102,629 |
| Sierra Leoneans | 74.2 /100 | #159 | Good $102,427 |
| Icelanders | 72.5 /100 | #160 | Good $102,261 |
Demographics Similar to Palestinians by Householder Income Ages 45 - 64 years
In terms of householder income ages 45 - 64 years, the demographic groups most similar to Palestinians are Immigrants from Southern Europe ($107,775, a difference of 0.050%), Northern European ($107,870, a difference of 0.14%), Immigrants from Serbia ($107,569, a difference of 0.14%), Immigrants from Kazakhstan ($107,378, a difference of 0.32%), and Immigrants from Moldova ($107,357, a difference of 0.34%).
| Demographics | Rating | Rank | Householder Income Ages 45 - 64 years |
| Croatians | 98.3 /100 | #92 | Exceptional $108,383 |
| Immigrants | Croatia | 98.2 /100 | #93 | Exceptional $108,304 |
| Sri Lankans | 98.2 /100 | #94 | Exceptional $108,270 |
| Immigrants | Hungary | 98.2 /100 | #95 | Exceptional $108,267 |
| Immigrants | Argentina | 98.2 /100 | #96 | Exceptional $108,264 |
| Northern Europeans | 97.8 /100 | #97 | Exceptional $107,870 |
| Immigrants | Southern Europe | 97.7 /100 | #98 | Exceptional $107,775 |
| Palestinians | 97.6 /100 | #99 | Exceptional $107,721 |
| Immigrants | Serbia | 97.4 /100 | #100 | Exceptional $107,569 |
| Immigrants | Kazakhstan | 97.2 /100 | #101 | Exceptional $107,378 |
| Immigrants | Moldova | 97.1 /100 | #102 | Exceptional $107,357 |
| Syrians | 96.9 /100 | #103 | Exceptional $107,207 |
| Immigrants | Ukraine | 96.7 /100 | #104 | Exceptional $107,079 |
| Macedonians | 96.7 /100 | #105 | Exceptional $107,074 |
| Armenians | 96.6 /100 | #106 | Exceptional $107,002 |