Scandinavian vs Immigrants from Taiwan Householder Income Ages 45 - 64 years

COMPARE

Scandinavian
Race
Ancestry
AfghanAfricanAlaska NativeAlaskan AthabascanAlbanianAleutAlsatianAmericanApacheArabArapahoArgentineanArmenianAssyrian/Chaldean/SyriacAustralianAustrianBahamianBangladeshiBarbadianBasqueBelgianBelizeanBermudanBhutaneseBlackfeetBolivianBrazilianBritishBritish West IndianBulgarianBurmeseCajunCambodianCanadianCape VerdeanCarpatho RusynCelticCentral AmericanCentral American IndianCherokeeCheyenneChickasawChileanChineseChippewaChoctawColombianColvilleComancheCosta RicanCreeCreekCroatianCrowCubanCypriotCzechCzechoslovakianDanishDelawareDominicanDutchDutch West IndianEastern EuropeanEcuadorianEgyptianEnglishEstonianEthiopianEuropeanFijianFilipinoFinnishFrenchFrench American IndianFrench CanadianGermanGerman RussianGhanaianGreekGuamanian/ChamorroGuatemalanGuyaneseHaitianHmongHonduranHopiHoumaHungarianIcelanderIndian (Asian)IndonesianInupiatIranianIraqiIrishIroquoisIsraeliItalianJamaicanJapaneseJordanianKenyanKiowaKoreanLaotianLatvianLebaneseLiberianLithuanianLumbeeLuxembourgerMacedonianMalaysianMalteseMarshalleseMenomineeMexicanMexican American IndianMongolianMoroccanNative HawaiianNavajoNepaleseNew ZealanderNicaraguanNigerianNorthern EuropeanNorwegianOkinawanOsageOttawaPaiutePakistaniPalestinianPanamanianParaguayanPennsylvania GermanPeruvianPimaPolishPortuguesePotawatomiPuebloPuerto RicanPuget Sound SalishRomanianRussianSalvadoranSamoanScandinavianScotch-IrishScottishSeminoleSenegaleseSerbianShoshoneSierra LeoneanSiouxSlavicSlovakSloveneSomaliSouth AfricanSouth AmericanSouth American IndianSoviet UnionSpaniardSpanishSpanish AmericanSpanish American IndianSri LankanSubsaharan AfricanSudaneseSwedishSwissSyrianTaiwaneseThaiTlingit-HaidaTohono O'OdhamTonganTrinidadian and TobagonianTsimshianTurkishU.S. Virgin IslanderUgandanUkrainianUruguayanUteVenezuelanVietnameseWelshWest IndianYakamaYaquiYugoslavianYumanYup'ikZimbabwean
Immigration
NonimmigrantsImmigrantsAfghanistanAfricaAlbaniaArgentinaArmeniaAsiaAustraliaAustriaBahamasBangladeshBarbadosBelarusBelgiumBelizeBoliviaBosnia and HerzegovinaBrazilBulgariaBurma/MyanmarCabo VerdeCambodiaCameroonCanadaCaribbeanCentral AmericaChileChinaColombiaCongoCosta RicaCroatiaCubaCzechoslovakiaDenmarkDominicaDominican RepublicEastern AfricaEastern AsiaEastern EuropeEcuadorEgyptEl SalvadorEnglandEritreaEthiopiaEuropeFijiFranceGermanyGhanaGreeceGrenadaGuatemalaGuyanaHaitiHondurasHong KongHungaryIndiaIndonesiaIranIraqIrelandIsraelItalyJamaicaJapanJordanKazakhstanKenyaKoreaKuwaitLaosLatin AmericaLatviaLebanonLiberiaLithuaniaMalaysiaMexicoMicronesiaMiddle AfricaMoldovaMoroccoNepalNetherlandsNicaraguaNigeriaNorth AmericaNorth MacedoniaNorthern AfricaNorthern EuropeNorwayOceaniaPakistanPanamaPeruPhilippinesPolandPortugalRomaniaRussiaSaudi ArabiaScotlandSenegalSerbiaSierra LeoneSingaporeSomaliaSouth AfricaSouth AmericaSouth Central AsiaSouth Eastern AsiaSouthern EuropeSpainSri LankaSt. Vincent and the GrenadinesSudanSwedenSwitzerlandSyriaThailandTrinidad and TobagoTurkeyUgandaUkraineUruguayUzbekistanVenezuelaVietnamWest IndiesWestern AfricaWestern AsiaWestern EuropeYemenZaireZimbabweAzores
Immigrants from Taiwan
Race
Ancestry
AfghanAfricanAlaska NativeAlaskan AthabascanAlbanianAleutAlsatianAmericanApacheArabArapahoArgentineanArmenianAssyrian/Chaldean/SyriacAustralianAustrianBahamianBangladeshiBarbadianBasqueBelgianBelizeanBermudanBhutaneseBlackfeetBolivianBrazilianBritishBritish West IndianBulgarianBurmeseCajunCambodianCanadianCape VerdeanCarpatho RusynCelticCentral AmericanCentral American IndianCherokeeCheyenneChickasawChileanChineseChippewaChoctawColombianColvilleComancheCosta RicanCreeCreekCroatianCrowCubanCypriotCzechCzechoslovakianDanishDelawareDominicanDutchDutch West IndianEastern EuropeanEcuadorianEgyptianEnglishEstonianEthiopianEuropeanFijianFilipinoFinnishFrenchFrench American IndianFrench CanadianGermanGerman RussianGhanaianGreekGuamanian/ChamorroGuatemalanGuyaneseHaitianHmongHonduranHopiHoumaHungarianIcelanderIndian (Asian)IndonesianInupiatIranianIraqiIrishIroquoisIsraeliItalianJamaicanJapaneseJordanianKenyanKiowaKoreanLaotianLatvianLebaneseLiberianLithuanianLumbeeLuxembourgerMacedonianMalaysianMalteseMarshalleseMenomineeMexicanMexican American IndianMongolianMoroccanNative HawaiianNavajoNepaleseNew ZealanderNicaraguanNigerianNorthern EuropeanNorwegianOkinawanOsageOttawaPaiutePakistaniPalestinianPanamanianParaguayanPennsylvania GermanPeruvianPimaPolishPortuguesePotawatomiPuebloPuerto RicanPuget Sound SalishRomanianRussianSalvadoranSamoanScotch-IrishScottishSeminoleSenegaleseSerbianShoshoneSierra LeoneanSiouxSlavicSlovakSloveneSomaliSouth AfricanSouth AmericanSouth American IndianSoviet UnionSpaniardSpanishSpanish AmericanSpanish American IndianSri LankanSubsaharan AfricanSudaneseSwedishSwissSyrianTaiwaneseThaiTlingit-HaidaTohono O'OdhamTonganTrinidadian and TobagonianTsimshianTurkishU.S. Virgin IslanderUgandanUkrainianUruguayanUteVenezuelanVietnameseWelshWest IndianYakamaYaquiYugoslavianYumanYup'ikZimbabwean
Immigration
NonimmigrantsImmigrantsAfghanistanAfricaAlbaniaArgentinaArmeniaAsiaAustraliaAustriaBahamasBangladeshBarbadosBelarusBelgiumBelizeBoliviaBosnia and HerzegovinaBrazilBulgariaBurma/MyanmarCabo VerdeCambodiaCameroonCanadaCaribbeanCentral AmericaChileChinaColombiaCongoCosta RicaCroatiaCubaCzechoslovakiaDenmarkDominicaDominican RepublicEastern AfricaEastern AsiaEastern EuropeEcuadorEgyptEl SalvadorEnglandEritreaEthiopiaEuropeFijiFranceGermanyGhanaGreeceGrenadaGuatemalaGuyanaHaitiHondurasHong KongHungaryIndiaIndonesiaIranIraqIrelandIsraelItalyJamaicaJapanJordanKazakhstanKenyaKoreaKuwaitLaosLatin AmericaLatviaLebanonLiberiaLithuaniaMalaysiaMexicoMicronesiaMiddle AfricaMoldovaMoroccoNepalNetherlandsNicaraguaNigeriaNorth AmericaNorth MacedoniaNorthern AfricaNorthern EuropeNorwayOceaniaPakistanPanamaPeruPhilippinesPolandPortugalRomaniaRussiaSaudi ArabiaScotlandSenegalSerbiaSierra LeoneSingaporeSomaliaSouth AfricaSouth AmericaSouth Central AsiaSouth Eastern AsiaSouthern EuropeSpainSri LankaSt. Vincent and the GrenadinesSudanSwedenSwitzerlandSyriaTaiwanThailandTrinidad and TobagoTurkeyUgandaUkraineUruguayUzbekistanVenezuelaVietnamWest IndiesWestern AfricaWestern AsiaWestern EuropeYemenZaireZimbabweAzores
Householder Income Ages 45 - 64 years
Income
Poverty
Unemployment
Labor Participation
Family Structure
Vehicle Availability
Education Level
Disability

Householder Income Ages 45 - 64 years Comparison

Scandinavians

Immigrants from Taiwan

Good
Exceptional
$102,969
HOUSEHOLDER INCOME AGES 45 - 64 YEARS
79.0/ 100
METRIC RATING
153rd/ 347
METRIC RANK
$135,508
HOUSEHOLDER INCOME AGES 45 - 64 YEARS
100.0/ 100
METRIC RATING
1st/ 347
METRIC RANK

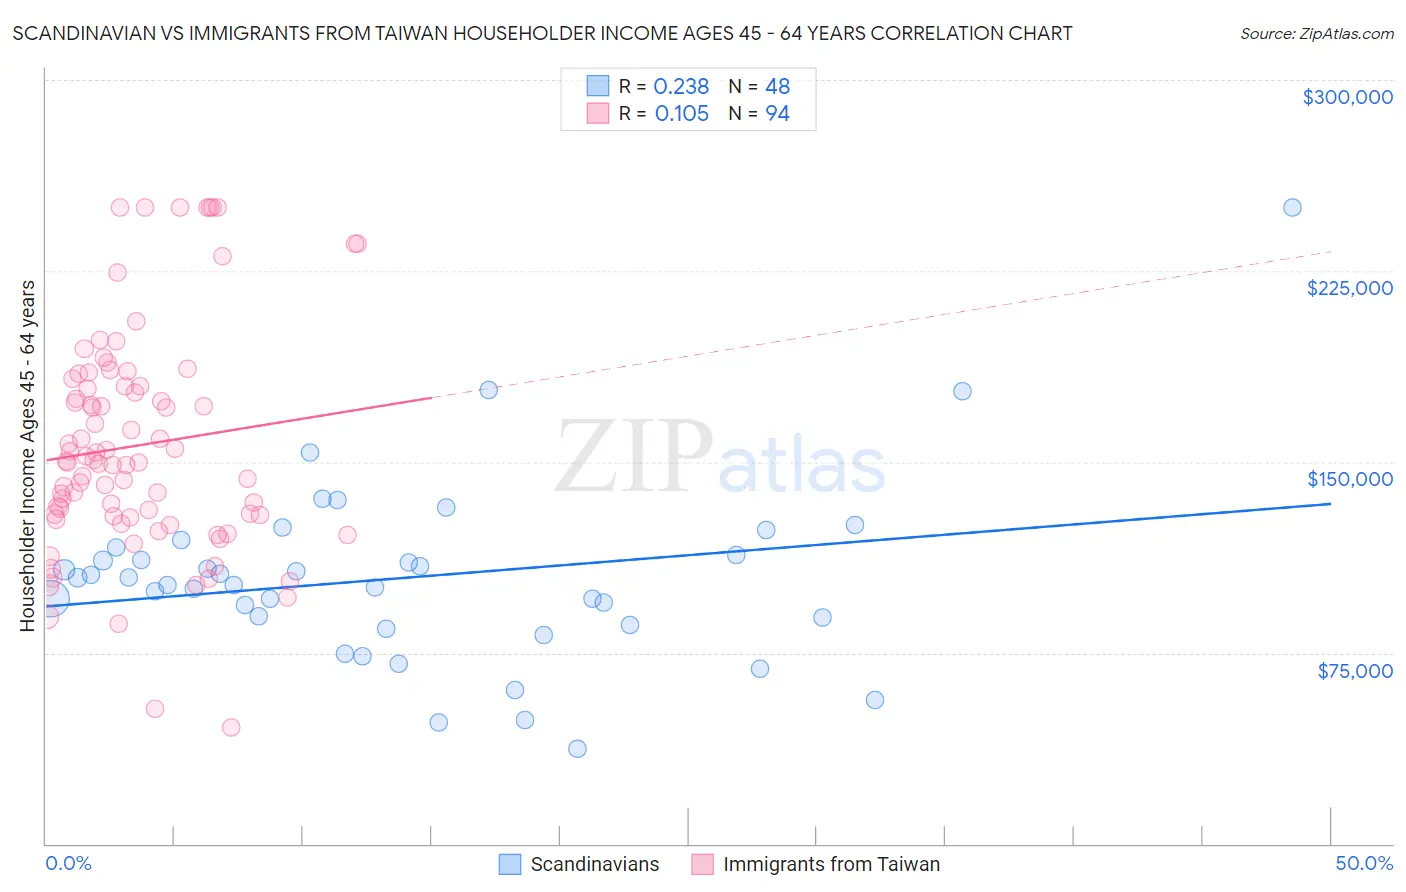
Scandinavian vs Immigrants from Taiwan Householder Income Ages 45 - 64 years Correlation Chart

The statistical analysis conducted on geographies consisting of 471,257,536 people shows a weak positive correlation between the proportion of Scandinavians and household income with householder between the ages 45 and 64 in the United States with a correlation coefficient (R) of 0.238 and weighted average of $102,969. Similarly, the statistical analysis conducted on geographies consisting of 297,970,743 people shows a poor positive correlation between the proportion of Immigrants from Taiwan and household income with householder between the ages 45 and 64 in the United States with a correlation coefficient (R) of 0.105 and weighted average of $135,508, a difference of 31.6%.
Scandinavian vs Immigrants from Taiwan Householder Income Ages 45 - 64 years

Householder Income Ages 45 - 64 years Correlation Summary

MeasurementScandinavianImmigrants from Taiwan
Minimum$37,396$45,758
Maximum$250,001$250,001
Range$212,605$204,243
Mean$104,566$156,467
Median$103,110$150,003
Interquartile 25% (IQ1)$87,340$128,525
Interquartile 75% (IQ3)$114,988$179,879
Interquartile Range (IQR)$27,648$51,354
Standard Deviation (Sample)$35,851$43,921
Standard Deviation (Population)$35,476$43,687

Similar Demographics by Householder Income Ages 45 - 64 years

Demographics Similar to Scandinavians by Householder Income Ages 45 - 64 years

In terms of householder income ages 45 - 64 years, the demographic groups most similar to Scandinavians are Slovene ($102,885, a difference of 0.080%), Irish ($103,067, a difference of 0.090%), Swiss ($103,071, a difference of 0.10%), Costa Rican ($102,779, a difference of 0.19%), and Carpatho Rusyn ($102,777, a difference of 0.19%).
DemographicsRating | RankHouseholder Income Ages 45 - 64 years
Immigrants | Chile
82.5
/100
|
#146
Excellent
$103,412
Basques
82.3
/100
|
#147
Excellent
$103,387
Immigrants | Germany
81.5
/100
|
#148
Excellent
$103,282
Immigrants | Sierra Leone
81.1
/100
|
#149
Excellent
$103,227
Immigrants | Peru
80.7
/100
|
#150
Excellent
$103,173
Swiss
79.9
/100
|
#151
Good
$103,071
Irish
79.8
/100
|
#152
Good
$103,067
Scandinavians
79.0
/100
|
#153
Good
$102,969
Slovenes
78.3
/100
|
#154
Good
$102,885
Costa Ricans
77.4
/100
|
#155
Good
$102,779
Carpatho Rusyns
77.4
/100
|
#156
Good
$102,777
Immigrants | Ethiopia
77.3
/100
|
#157
Good
$102,763
Slavs
76.1
/100
|
#158
Good
$102,629
Sierra Leoneans
74.2
/100
|
#159
Good
$102,427
Icelanders
72.5
/100
|
#160
Good
$102,261

Demographics Similar to Immigrants from Taiwan by Householder Income Ages 45 - 64 years

In terms of householder income ages 45 - 64 years, the demographic groups most similar to Immigrants from Taiwan are Filipino ($134,910, a difference of 0.44%), Immigrants from India ($132,488, a difference of 2.3%), Thai ($129,560, a difference of 4.6%), Immigrants from Singapore ($129,514, a difference of 4.6%), and Iranian ($129,350, a difference of 4.8%).
DemographicsRating | RankHouseholder Income Ages 45 - 64 years
Immigrants | Taiwan
100.0
/100
|
#1
Exceptional
$135,508
Filipinos
100.0
/100
|
#2
Exceptional
$134,910
Immigrants | India
100.0
/100
|
#3
Exceptional
$132,488
Thais
100.0
/100
|
#4
Exceptional
$129,560
Immigrants | Singapore
100.0
/100
|
#5
Exceptional
$129,514
Iranians
100.0
/100
|
#6
Exceptional
$129,350
Immigrants | Hong Kong
100.0
/100
|
#7
Exceptional
$127,500
Immigrants | Iran
100.0
/100
|
#8
Exceptional
$126,940
Okinawans
100.0
/100
|
#9
Exceptional
$124,796
Immigrants | South Central Asia
100.0
/100
|
#10
Exceptional
$124,188
Cypriots
100.0
/100
|
#11
Exceptional
$123,396
Immigrants | Israel
100.0
/100
|
#12
Exceptional
$122,893
Immigrants | Ireland
100.0
/100
|
#13
Exceptional
$122,757
Indians (Asian)
100.0
/100
|
#14
Exceptional
$122,343
Immigrants | Eastern Asia
100.0
/100
|
#15
Exceptional
$122,222