Immigrants from South Eastern Asia vs Immigrants from Nigeria Householder Income Ages 45 - 64 years
COMPARE
Immigrants from South Eastern Asia
Immigrants from Nigeria
Householder Income Ages 45 - 64 years
Householder Income Ages 45 - 64 years Comparison
Immigrants from South Eastern Asia
Immigrants from Nigeria
$106,109
HOUSEHOLDER INCOME AGES 45 - 64 YEARS
94.8/ 100
METRIC RATING
120th/ 347
METRIC RANK
$94,804
HOUSEHOLDER INCOME AGES 45 - 64 YEARS
5.9/ 100
METRIC RATING
221st/ 347
METRIC RANK
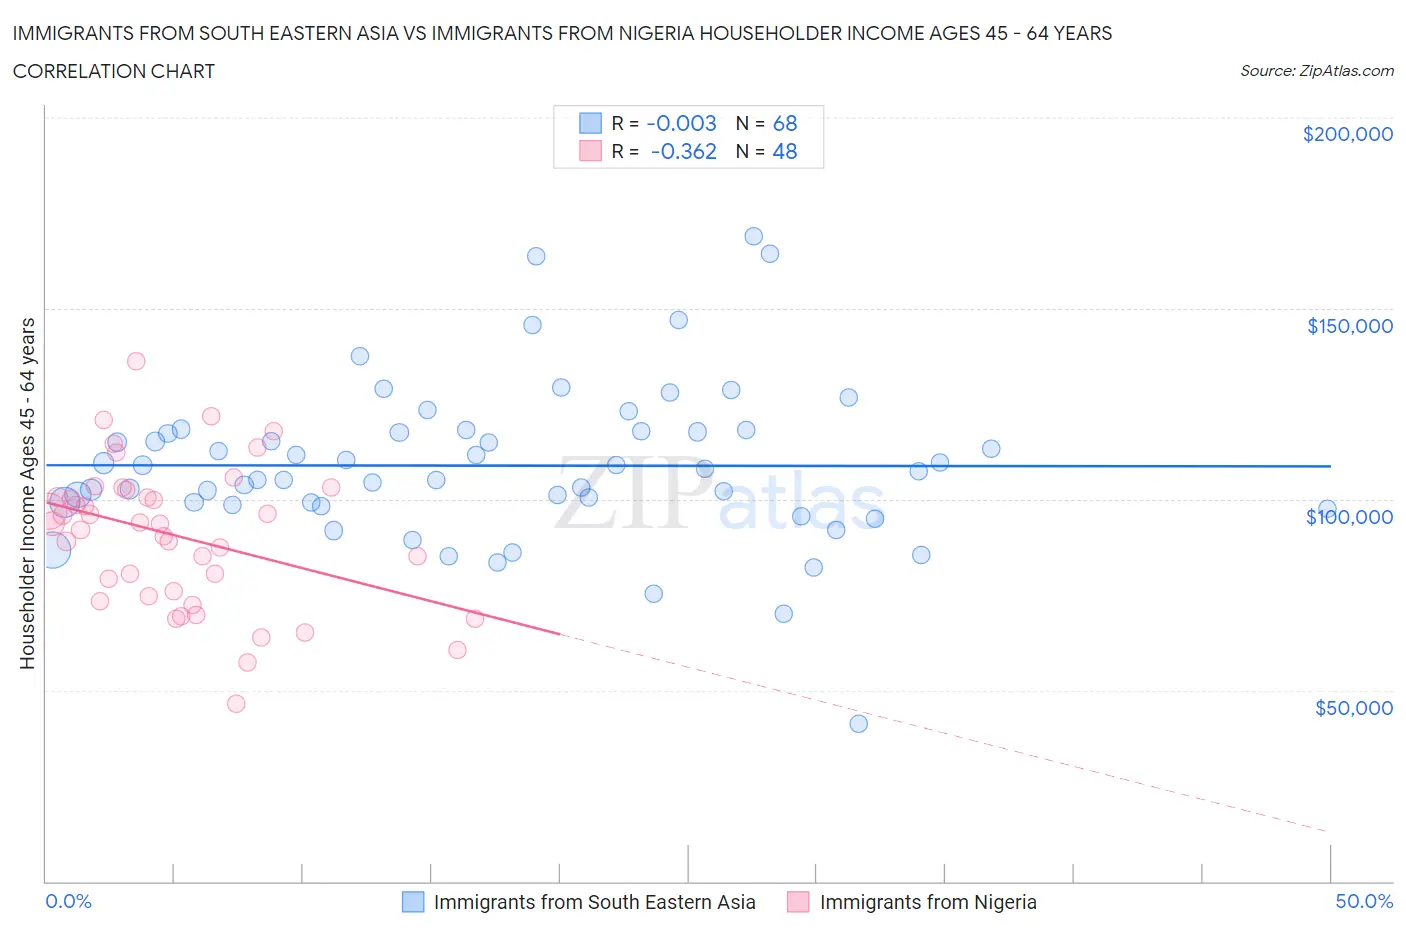
Immigrants from South Eastern Asia vs Immigrants from Nigeria Householder Income Ages 45 - 64 years Correlation Chart
The statistical analysis conducted on geographies consisting of 511,033,304 people shows no correlation between the proportion of Immigrants from South Eastern Asia and household income with householder between the ages 45 and 64 in the United States with a correlation coefficient (R) of -0.003 and weighted average of $106,109. Similarly, the statistical analysis conducted on geographies consisting of 283,069,423 people shows a mild negative correlation between the proportion of Immigrants from Nigeria and household income with householder between the ages 45 and 64 in the United States with a correlation coefficient (R) of -0.362 and weighted average of $94,804, a difference of 11.9%.
Householder Income Ages 45 - 64 years Correlation Summary
| Measurement | Immigrants from South Eastern Asia | Immigrants from Nigeria |
| Minimum | $41,250 | $46,429 |
| Maximum | $168,774 | $136,191 |
| Range | $127,524 | $89,762 |
| Mean | $108,858 | $90,499 |
| Median | $107,753 | $93,669 |
| Interquartile 25% (IQ1) | $98,855 | $75,303 |
| Interquartile 75% (IQ3) | $117,791 | $101,492 |
| Interquartile Range (IQR) | $18,936 | $26,189 |
| Standard Deviation (Sample) | $20,977 | $18,699 |
| Standard Deviation (Population) | $20,822 | $18,504 |
Similar Demographics by Householder Income Ages 45 - 64 years
Demographics Similar to Immigrants from South Eastern Asia by Householder Income Ages 45 - 64 years
In terms of householder income ages 45 - 64 years, the demographic groups most similar to Immigrants from South Eastern Asia are Immigrants from Jordan ($106,164, a difference of 0.050%), Immigrants from Western Asia ($106,217, a difference of 0.10%), Albanian ($106,243, a difference of 0.13%), British ($106,264, a difference of 0.15%), and Polish ($105,952, a difference of 0.15%).
| Demographics | Rating | Rank | Householder Income Ages 45 - 64 years |
| Europeans | 95.4 /100 | #113 | Exceptional $106,367 |
| Immigrants | Poland | 95.3 /100 | #114 | Exceptional $106,319 |
| Immigrants | Kuwait | 95.2 /100 | #115 | Exceptional $106,285 |
| British | 95.2 /100 | #116 | Exceptional $106,264 |
| Albanians | 95.1 /100 | #117 | Exceptional $106,243 |
| Immigrants | Western Asia | 95.0 /100 | #118 | Exceptional $106,217 |
| Immigrants | Jordan | 94.9 /100 | #119 | Exceptional $106,164 |
| Immigrants | South Eastern Asia | 94.8 /100 | #120 | Exceptional $106,109 |
| Poles | 94.4 /100 | #121 | Exceptional $105,952 |
| Immigrants | North Macedonia | 94.2 /100 | #122 | Exceptional $105,892 |
| Danes | 93.4 /100 | #123 | Exceptional $105,619 |
| Immigrants | Northern Africa | 92.8 /100 | #124 | Exceptional $105,430 |
| Pakistanis | 92.4 /100 | #125 | Exceptional $105,317 |
| Portuguese | 92.4 /100 | #126 | Exceptional $105,309 |
| Immigrants | Saudi Arabia | 92.2 /100 | #127 | Exceptional $105,249 |
Demographics Similar to Immigrants from Nigeria by Householder Income Ages 45 - 64 years
In terms of householder income ages 45 - 64 years, the demographic groups most similar to Immigrants from Nigeria are Salvadoran ($94,842, a difference of 0.040%), Immigrants from Armenia ($94,863, a difference of 0.060%), Delaware ($94,914, a difference of 0.12%), Immigrants from Ghana ($94,982, a difference of 0.19%), and Malaysian ($94,517, a difference of 0.30%).
| Demographics | Rating | Rank | Householder Income Ages 45 - 64 years |
| Panamanians | 10.6 /100 | #214 | Poor $96,066 |
| Nigerians | 8.2 /100 | #215 | Tragic $95,492 |
| Immigrants | Venezuela | 7.6 /100 | #216 | Tragic $95,342 |
| Immigrants | Ghana | 6.4 /100 | #217 | Tragic $94,982 |
| Delaware | 6.2 /100 | #218 | Tragic $94,914 |
| Immigrants | Armenia | 6.1 /100 | #219 | Tragic $94,863 |
| Salvadorans | 6.0 /100 | #220 | Tragic $94,842 |
| Immigrants | Nigeria | 5.9 /100 | #221 | Tragic $94,804 |
| Malaysians | 5.2 /100 | #222 | Tragic $94,517 |
| Immigrants | Nonimmigrants | 5.0 /100 | #223 | Tragic $94,448 |
| Immigrants | Bosnia and Herzegovina | 4.6 /100 | #224 | Tragic $94,288 |
| Bermudans | 4.4 /100 | #225 | Tragic $94,197 |
| Immigrants | Azores | 4.3 /100 | #226 | Tragic $94,138 |
| Alaska Natives | 4.0 /100 | #227 | Tragic $93,991 |
| Immigrants | Panama | 3.7 /100 | #228 | Tragic $93,815 |