Immigrants from Kuwait vs Immigrants from Nigeria Householder Income Ages 45 - 64 years
COMPARE
Immigrants from Kuwait
Immigrants from Nigeria
Householder Income Ages 45 - 64 years
Householder Income Ages 45 - 64 years Comparison
Immigrants from Kuwait
Immigrants from Nigeria
$106,285
HOUSEHOLDER INCOME AGES 45 - 64 YEARS
95.2/ 100
METRIC RATING
115th/ 347
METRIC RANK
$94,804
HOUSEHOLDER INCOME AGES 45 - 64 YEARS
5.9/ 100
METRIC RATING
221st/ 347
METRIC RANK
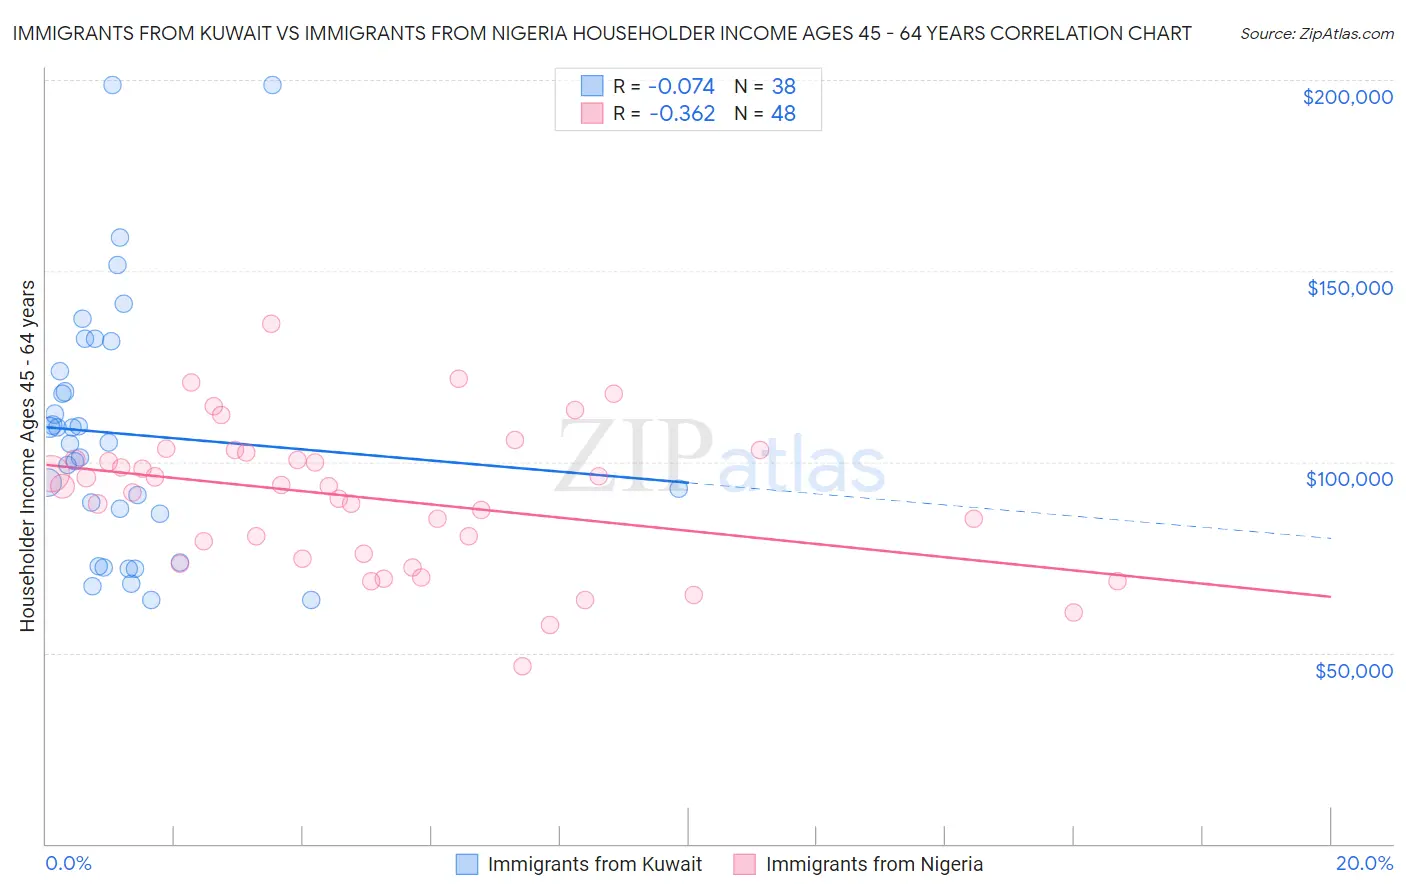
Immigrants from Kuwait vs Immigrants from Nigeria Householder Income Ages 45 - 64 years Correlation Chart
The statistical analysis conducted on geographies consisting of 136,856,886 people shows a slight negative correlation between the proportion of Immigrants from Kuwait and household income with householder between the ages 45 and 64 in the United States with a correlation coefficient (R) of -0.074 and weighted average of $106,285. Similarly, the statistical analysis conducted on geographies consisting of 283,069,423 people shows a mild negative correlation between the proportion of Immigrants from Nigeria and household income with householder between the ages 45 and 64 in the United States with a correlation coefficient (R) of -0.362 and weighted average of $94,804, a difference of 12.1%.
Householder Income Ages 45 - 64 years Correlation Summary
| Measurement | Immigrants from Kuwait | Immigrants from Nigeria |
| Minimum | $63,767 | $46,429 |
| Maximum | $198,648 | $136,191 |
| Range | $134,881 | $89,762 |
| Mean | $107,348 | $90,499 |
| Median | $104,899 | $93,669 |
| Interquartile 25% (IQ1) | $86,528 | $75,303 |
| Interquartile 75% (IQ3) | $123,748 | $101,492 |
| Interquartile Range (IQR) | $37,220 | $26,189 |
| Standard Deviation (Sample) | $33,135 | $18,699 |
| Standard Deviation (Population) | $32,696 | $18,504 |
Similar Demographics by Householder Income Ages 45 - 64 years
Demographics Similar to Immigrants from Kuwait by Householder Income Ages 45 - 64 years
In terms of householder income ages 45 - 64 years, the demographic groups most similar to Immigrants from Kuwait are British ($106,264, a difference of 0.020%), Immigrants from Poland ($106,319, a difference of 0.030%), Albanian ($106,243, a difference of 0.040%), Immigrants from Western Asia ($106,217, a difference of 0.060%), and European ($106,367, a difference of 0.080%).
| Demographics | Rating | Rank | Householder Income Ages 45 - 64 years |
| Zimbabweans | 96.3 /100 | #108 | Exceptional $106,849 |
| Chileans | 95.9 /100 | #109 | Exceptional $106,611 |
| Immigrants | Brazil | 95.6 /100 | #110 | Exceptional $106,470 |
| Immigrants | Vietnam | 95.5 /100 | #111 | Exceptional $106,417 |
| Swedes | 95.4 /100 | #112 | Exceptional $106,377 |
| Europeans | 95.4 /100 | #113 | Exceptional $106,367 |
| Immigrants | Poland | 95.3 /100 | #114 | Exceptional $106,319 |
| Immigrants | Kuwait | 95.2 /100 | #115 | Exceptional $106,285 |
| British | 95.2 /100 | #116 | Exceptional $106,264 |
| Albanians | 95.1 /100 | #117 | Exceptional $106,243 |
| Immigrants | Western Asia | 95.0 /100 | #118 | Exceptional $106,217 |
| Immigrants | Jordan | 94.9 /100 | #119 | Exceptional $106,164 |
| Immigrants | South Eastern Asia | 94.8 /100 | #120 | Exceptional $106,109 |
| Poles | 94.4 /100 | #121 | Exceptional $105,952 |
| Immigrants | North Macedonia | 94.2 /100 | #122 | Exceptional $105,892 |
Demographics Similar to Immigrants from Nigeria by Householder Income Ages 45 - 64 years
In terms of householder income ages 45 - 64 years, the demographic groups most similar to Immigrants from Nigeria are Salvadoran ($94,842, a difference of 0.040%), Immigrants from Armenia ($94,863, a difference of 0.060%), Delaware ($94,914, a difference of 0.12%), Immigrants from Ghana ($94,982, a difference of 0.19%), and Malaysian ($94,517, a difference of 0.30%).
| Demographics | Rating | Rank | Householder Income Ages 45 - 64 years |
| Panamanians | 10.6 /100 | #214 | Poor $96,066 |
| Nigerians | 8.2 /100 | #215 | Tragic $95,492 |
| Immigrants | Venezuela | 7.6 /100 | #216 | Tragic $95,342 |
| Immigrants | Ghana | 6.4 /100 | #217 | Tragic $94,982 |
| Delaware | 6.2 /100 | #218 | Tragic $94,914 |
| Immigrants | Armenia | 6.1 /100 | #219 | Tragic $94,863 |
| Salvadorans | 6.0 /100 | #220 | Tragic $94,842 |
| Immigrants | Nigeria | 5.9 /100 | #221 | Tragic $94,804 |
| Malaysians | 5.2 /100 | #222 | Tragic $94,517 |
| Immigrants | Nonimmigrants | 5.0 /100 | #223 | Tragic $94,448 |
| Immigrants | Bosnia and Herzegovina | 4.6 /100 | #224 | Tragic $94,288 |
| Bermudans | 4.4 /100 | #225 | Tragic $94,197 |
| Immigrants | Azores | 4.3 /100 | #226 | Tragic $94,138 |
| Alaska Natives | 4.0 /100 | #227 | Tragic $93,991 |
| Immigrants | Panama | 3.7 /100 | #228 | Tragic $93,815 |