Immigrants from China vs Immigrants from Greece Median Earnings
COMPARE
Immigrants from China
Immigrants from Greece
Median Earnings
Median Earnings Comparison
Immigrants from China
Immigrants from Greece
$56,638
MEDIAN EARNINGS
100.0/ 100
METRIC RATING
13th/ 347
METRIC RANK
$53,282
MEDIAN EARNINGS
100.0/ 100
METRIC RATING
33rd/ 347
METRIC RANK
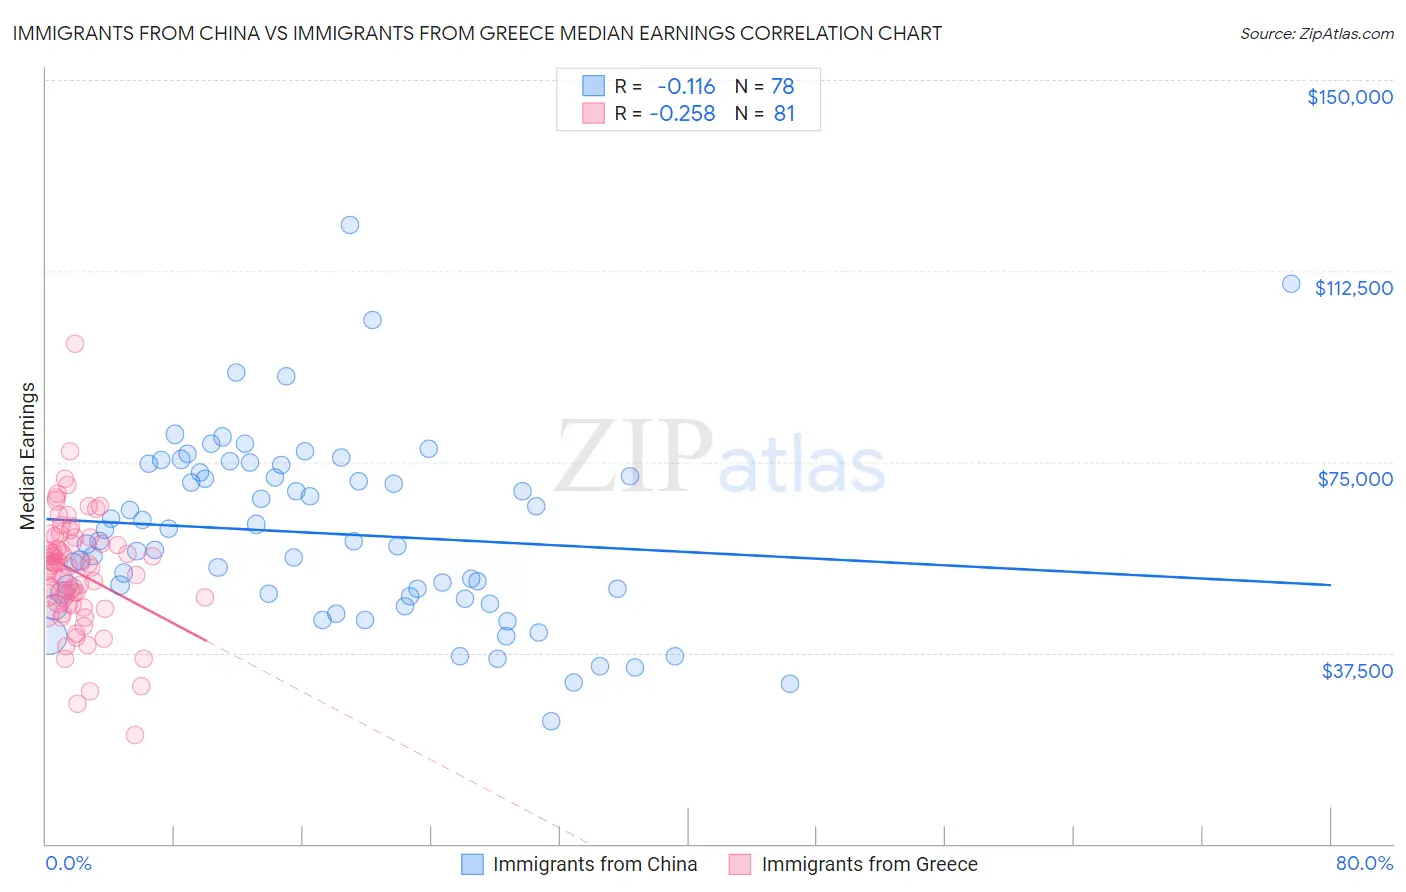
Immigrants from China vs Immigrants from Greece Median Earnings Correlation Chart
The statistical analysis conducted on geographies consisting of 457,063,643 people shows a poor negative correlation between the proportion of Immigrants from China and median earnings in the United States with a correlation coefficient (R) of -0.116 and weighted average of $56,638. Similarly, the statistical analysis conducted on geographies consisting of 216,859,908 people shows a weak negative correlation between the proportion of Immigrants from Greece and median earnings in the United States with a correlation coefficient (R) of -0.258 and weighted average of $53,282, a difference of 6.3%.
Median Earnings Correlation Summary
| Measurement | Immigrants from China | Immigrants from Greece |
| Minimum | $23,942 | $21,296 |
| Maximum | $121,459 | $98,167 |
| Range | $97,517 | $76,871 |
| Mean | $60,963 | $53,424 |
| Median | $59,099 | $54,495 |
| Interquartile 25% (IQ1) | $48,648 | $47,153 |
| Interquartile 75% (IQ3) | $73,028 | $59,515 |
| Interquartile Range (IQR) | $24,380 | $12,362 |
| Standard Deviation (Sample) | $18,079 | $11,394 |
| Standard Deviation (Population) | $17,962 | $11,323 |
Demographics Similar to Immigrants from China and Immigrants from Greece by Median Earnings
In terms of median earnings, the demographic groups most similar to Immigrants from China are Immigrants from Australia ($56,305, a difference of 0.59%), Indian (Asian) ($56,253, a difference of 0.68%), Immigrants from Eastern Asia ($56,183, a difference of 0.81%), Eastern European ($55,084, a difference of 2.8%), and Immigrants from Japan ($54,938, a difference of 3.1%). Similarly, the demographic groups most similar to Immigrants from Greece are Immigrants from Asia ($53,310, a difference of 0.050%), Russian ($53,334, a difference of 0.10%), Cambodian ($53,386, a difference of 0.19%), Immigrants from Russia ($53,457, a difference of 0.33%), and Immigrants from France ($53,490, a difference of 0.39%).
| Demographics | Rating | Rank | Median Earnings |
| Immigrants | China | 100.0 /100 | #13 | Exceptional $56,638 |
| Immigrants | Australia | 100.0 /100 | #14 | Exceptional $56,305 |
| Indians (Asian) | 100.0 /100 | #15 | Exceptional $56,253 |
| Immigrants | Eastern Asia | 100.0 /100 | #16 | Exceptional $56,183 |
| Eastern Europeans | 100.0 /100 | #17 | Exceptional $55,084 |
| Immigrants | Japan | 100.0 /100 | #18 | Exceptional $54,938 |
| Immigrants | Belgium | 100.0 /100 | #19 | Exceptional $54,679 |
| Cypriots | 100.0 /100 | #20 | Exceptional $54,589 |
| Burmese | 100.0 /100 | #21 | Exceptional $54,559 |
| Immigrants | Korea | 100.0 /100 | #22 | Exceptional $54,530 |
| Immigrants | Sweden | 100.0 /100 | #23 | Exceptional $54,478 |
| Soviet Union | 100.0 /100 | #24 | Exceptional $54,290 |
| Turks | 100.0 /100 | #25 | Exceptional $53,919 |
| Immigrants | Northern Europe | 100.0 /100 | #26 | Exceptional $53,872 |
| Asians | 100.0 /100 | #27 | Exceptional $53,690 |
| Immigrants | France | 100.0 /100 | #28 | Exceptional $53,490 |
| Immigrants | Russia | 100.0 /100 | #29 | Exceptional $53,457 |
| Cambodians | 100.0 /100 | #30 | Exceptional $53,386 |
| Russians | 100.0 /100 | #31 | Exceptional $53,334 |
| Immigrants | Asia | 100.0 /100 | #32 | Exceptional $53,310 |
| Immigrants | Greece | 100.0 /100 | #33 | Exceptional $53,282 |