Pennsylvania German vs Immigrants from Greece Median Earnings
COMPARE
Pennsylvania German
Immigrants from Greece
Median Earnings
Median Earnings Comparison
Pennsylvania Germans
Immigrants from Greece
$42,615
MEDIAN EARNINGS
0.5/ 100
METRIC RATING
271st/ 347
METRIC RANK
$53,282
MEDIAN EARNINGS
100.0/ 100
METRIC RATING
33rd/ 347
METRIC RANK
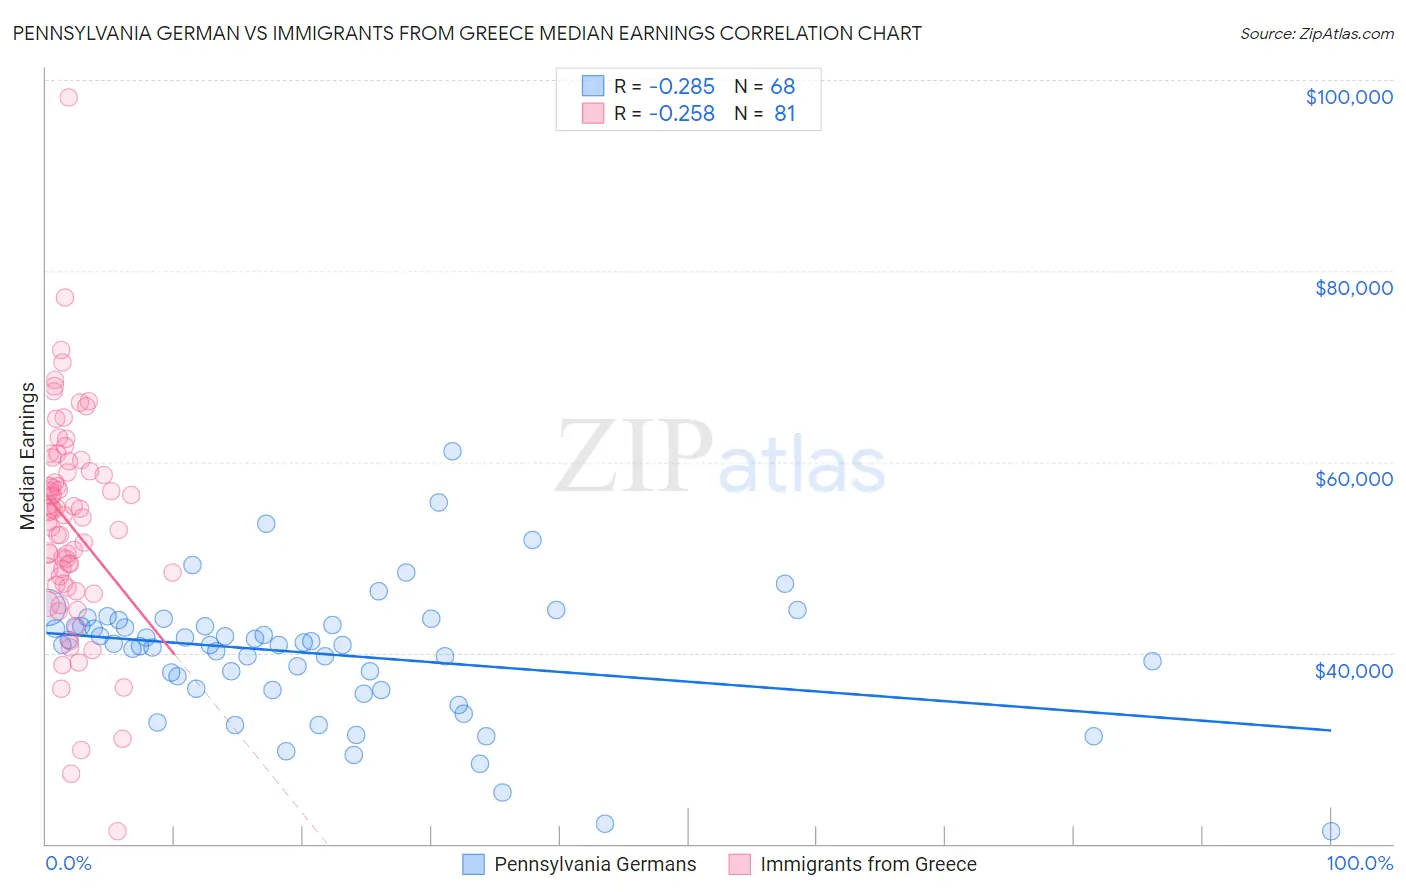
Pennsylvania German vs Immigrants from Greece Median Earnings Correlation Chart
The statistical analysis conducted on geographies consisting of 234,087,071 people shows a weak negative correlation between the proportion of Pennsylvania Germans and median earnings in the United States with a correlation coefficient (R) of -0.285 and weighted average of $42,615. Similarly, the statistical analysis conducted on geographies consisting of 216,859,908 people shows a weak negative correlation between the proportion of Immigrants from Greece and median earnings in the United States with a correlation coefficient (R) of -0.258 and weighted average of $53,282, a difference of 25.0%.
Median Earnings Correlation Summary
| Measurement | Pennsylvania German | Immigrants from Greece |
| Minimum | $21,250 | $21,296 |
| Maximum | $61,146 | $98,167 |
| Range | $39,896 | $76,871 |
| Mean | $39,881 | $53,424 |
| Median | $40,836 | $54,495 |
| Interquartile 25% (IQ1) | $36,214 | $47,153 |
| Interquartile 75% (IQ3) | $42,893 | $59,515 |
| Interquartile Range (IQR) | $6,679 | $12,362 |
| Standard Deviation (Sample) | $6,983 | $11,394 |
| Standard Deviation (Population) | $6,932 | $11,323 |
Similar Demographics by Median Earnings
Demographics Similar to Pennsylvania Germans by Median Earnings
In terms of median earnings, the demographic groups most similar to Pennsylvania Germans are Osage ($42,651, a difference of 0.090%), Belizean ($42,702, a difference of 0.21%), American ($42,742, a difference of 0.30%), Cree ($42,777, a difference of 0.38%), and Iroquois ($42,430, a difference of 0.43%).
| Demographics | Rating | Rank | Median Earnings |
| Immigrants | Liberia | 0.7 /100 | #264 | Tragic $42,923 |
| Salvadorans | 0.7 /100 | #265 | Tragic $42,912 |
| Immigrants | Laos | 0.7 /100 | #266 | Tragic $42,884 |
| Cree | 0.6 /100 | #267 | Tragic $42,777 |
| Americans | 0.6 /100 | #268 | Tragic $42,742 |
| Belizeans | 0.5 /100 | #269 | Tragic $42,702 |
| Osage | 0.5 /100 | #270 | Tragic $42,651 |
| Pennsylvania Germans | 0.5 /100 | #271 | Tragic $42,615 |
| Iroquois | 0.4 /100 | #272 | Tragic $42,430 |
| Immigrants | Dominica | 0.4 /100 | #273 | Tragic $42,420 |
| Immigrants | El Salvador | 0.4 /100 | #274 | Tragic $42,413 |
| Immigrants | Belize | 0.3 /100 | #275 | Tragic $42,339 |
| Spanish Americans | 0.3 /100 | #276 | Tragic $42,316 |
| Central Americans | 0.3 /100 | #277 | Tragic $42,280 |
| Cajuns | 0.3 /100 | #278 | Tragic $42,189 |
Demographics Similar to Immigrants from Greece by Median Earnings
In terms of median earnings, the demographic groups most similar to Immigrants from Greece are Immigrants from Sri Lanka ($53,268, a difference of 0.030%), Immigrants from Asia ($53,310, a difference of 0.050%), Russian ($53,334, a difference of 0.10%), Immigrants from Switzerland ($53,211, a difference of 0.13%), and Immigrants from Denmark ($53,186, a difference of 0.18%).
| Demographics | Rating | Rank | Median Earnings |
| Immigrants | Northern Europe | 100.0 /100 | #26 | Exceptional $53,872 |
| Asians | 100.0 /100 | #27 | Exceptional $53,690 |
| Immigrants | France | 100.0 /100 | #28 | Exceptional $53,490 |
| Immigrants | Russia | 100.0 /100 | #29 | Exceptional $53,457 |
| Cambodians | 100.0 /100 | #30 | Exceptional $53,386 |
| Russians | 100.0 /100 | #31 | Exceptional $53,334 |
| Immigrants | Asia | 100.0 /100 | #32 | Exceptional $53,310 |
| Immigrants | Greece | 100.0 /100 | #33 | Exceptional $53,282 |
| Immigrants | Sri Lanka | 100.0 /100 | #34 | Exceptional $53,268 |
| Immigrants | Switzerland | 100.0 /100 | #35 | Exceptional $53,211 |
| Immigrants | Denmark | 100.0 /100 | #36 | Exceptional $53,186 |
| Immigrants | Belarus | 100.0 /100 | #37 | Exceptional $53,043 |
| Latvians | 100.0 /100 | #38 | Exceptional $53,001 |
| Immigrants | Turkey | 100.0 /100 | #39 | Exceptional $52,960 |
| Israelis | 100.0 /100 | #40 | Exceptional $52,937 |