Iraqi vs Immigrants from Jamaica Householder Income Ages 45 - 64 years
COMPARE
Iraqi
Immigrants from Jamaica
Householder Income Ages 45 - 64 years
Householder Income Ages 45 - 64 years Comparison
Iraqis
Immigrants from Jamaica
$99,387
HOUSEHOLDER INCOME AGES 45 - 64 YEARS
38.5/ 100
METRIC RATING
187th/ 347
METRIC RANK
$87,035
HOUSEHOLDER INCOME AGES 45 - 64 YEARS
0.1/ 100
METRIC RATING
278th/ 347
METRIC RANK
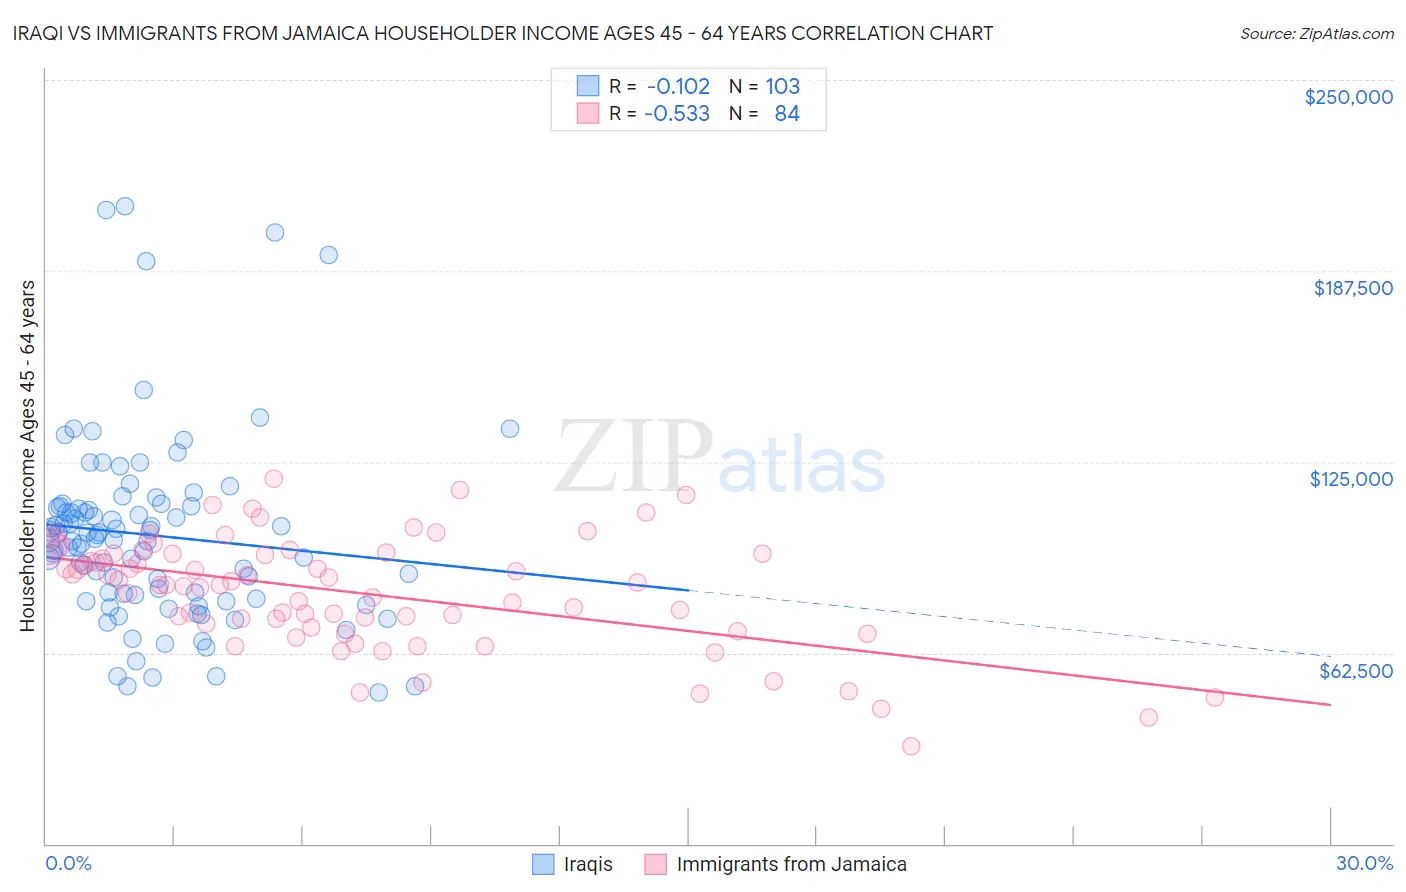
Iraqi vs Immigrants from Jamaica Householder Income Ages 45 - 64 years Correlation Chart
The statistical analysis conducted on geographies consisting of 170,546,926 people shows a poor negative correlation between the proportion of Iraqis and household income with householder between the ages 45 and 64 in the United States with a correlation coefficient (R) of -0.102 and weighted average of $99,387. Similarly, the statistical analysis conducted on geographies consisting of 301,245,641 people shows a substantial negative correlation between the proportion of Immigrants from Jamaica and household income with householder between the ages 45 and 64 in the United States with a correlation coefficient (R) of -0.533 and weighted average of $87,035, a difference of 14.2%.
Householder Income Ages 45 - 64 years Correlation Summary
| Measurement | Iraqi | Immigrants from Jamaica |
| Minimum | $49,554 | $31,923 |
| Maximum | $208,614 | $119,503 |
| Range | $159,060 | $87,580 |
| Mean | $101,029 | $82,100 |
| Median | $99,398 | $84,769 |
| Interquartile 25% (IQ1) | $81,325 | $71,502 |
| Interquartile 75% (IQ3) | $110,313 | $94,805 |
| Interquartile Range (IQR) | $28,988 | $23,303 |
| Standard Deviation (Sample) | $30,760 | $18,162 |
| Standard Deviation (Population) | $30,611 | $18,054 |
Similar Demographics by Householder Income Ages 45 - 64 years
Demographics Similar to Iraqis by Householder Income Ages 45 - 64 years
In terms of householder income ages 45 - 64 years, the demographic groups most similar to Iraqis are Immigrants from Portugal ($99,203, a difference of 0.19%), Immigrants from South America ($99,126, a difference of 0.26%), Dutch ($99,650, a difference of 0.27%), French Canadian ($99,093, a difference of 0.30%), and Colombian ($99,772, a difference of 0.39%).
| Demographics | Rating | Rank | Householder Income Ages 45 - 64 years |
| Aleuts | 46.6 /100 | #180 | Average $100,052 |
| Immigrants | Immigrants | 45.3 /100 | #181 | Average $99,943 |
| Finns | 44.8 /100 | #182 | Average $99,904 |
| Spaniards | 44.6 /100 | #183 | Average $99,889 |
| French | 43.8 /100 | #184 | Average $99,824 |
| Colombians | 43.2 /100 | #185 | Average $99,772 |
| Dutch | 41.7 /100 | #186 | Average $99,650 |
| Iraqis | 38.5 /100 | #187 | Fair $99,387 |
| Immigrants | Portugal | 36.3 /100 | #188 | Fair $99,203 |
| Immigrants | South America | 35.4 /100 | #189 | Fair $99,126 |
| French Canadians | 35.1 /100 | #190 | Fair $99,093 |
| Kenyans | 33.7 /100 | #191 | Fair $98,970 |
| Celtics | 32.9 /100 | #192 | Fair $98,896 |
| Hawaiians | 31.6 /100 | #193 | Fair $98,778 |
| Uruguayans | 30.3 /100 | #194 | Fair $98,660 |
Demographics Similar to Immigrants from Jamaica by Householder Income Ages 45 - 64 years
In terms of householder income ages 45 - 64 years, the demographic groups most similar to Immigrants from Jamaica are Yakama ($86,992, a difference of 0.050%), Immigrants from Somalia ($86,987, a difference of 0.050%), Yaqui ($86,914, a difference of 0.14%), Senegalese ($86,897, a difference of 0.16%), and Cree ($87,185, a difference of 0.17%).
| Demographics | Rating | Rank | Householder Income Ages 45 - 64 years |
| Guatemalans | 0.2 /100 | #271 | Tragic $87,705 |
| Cape Verdeans | 0.2 /100 | #272 | Tragic $87,580 |
| Spanish American Indians | 0.2 /100 | #273 | Tragic $87,561 |
| Iroquois | 0.1 /100 | #274 | Tragic $87,255 |
| Immigrants | Belize | 0.1 /100 | #275 | Tragic $87,229 |
| Immigrants | Latin America | 0.1 /100 | #276 | Tragic $87,219 |
| Cree | 0.1 /100 | #277 | Tragic $87,185 |
| Immigrants | Jamaica | 0.1 /100 | #278 | Tragic $87,035 |
| Yakama | 0.1 /100 | #279 | Tragic $86,992 |
| Immigrants | Somalia | 0.1 /100 | #280 | Tragic $86,987 |
| Yaqui | 0.1 /100 | #281 | Tragic $86,914 |
| Senegalese | 0.1 /100 | #282 | Tragic $86,897 |
| Mexicans | 0.1 /100 | #283 | Tragic $86,816 |
| Central American Indians | 0.1 /100 | #284 | Tragic $86,764 |
| Blackfeet | 0.1 /100 | #285 | Tragic $86,595 |