Immigrants from Brazil vs Immigrants from Jamaica Householder Income Ages 45 - 64 years
COMPARE
Immigrants from Brazil
Immigrants from Jamaica
Householder Income Ages 45 - 64 years
Householder Income Ages 45 - 64 years Comparison
Immigrants from Brazil
Immigrants from Jamaica
$106,470
HOUSEHOLDER INCOME AGES 45 - 64 YEARS
95.6/ 100
METRIC RATING
110th/ 347
METRIC RANK
$87,035
HOUSEHOLDER INCOME AGES 45 - 64 YEARS
0.1/ 100
METRIC RATING
278th/ 347
METRIC RANK
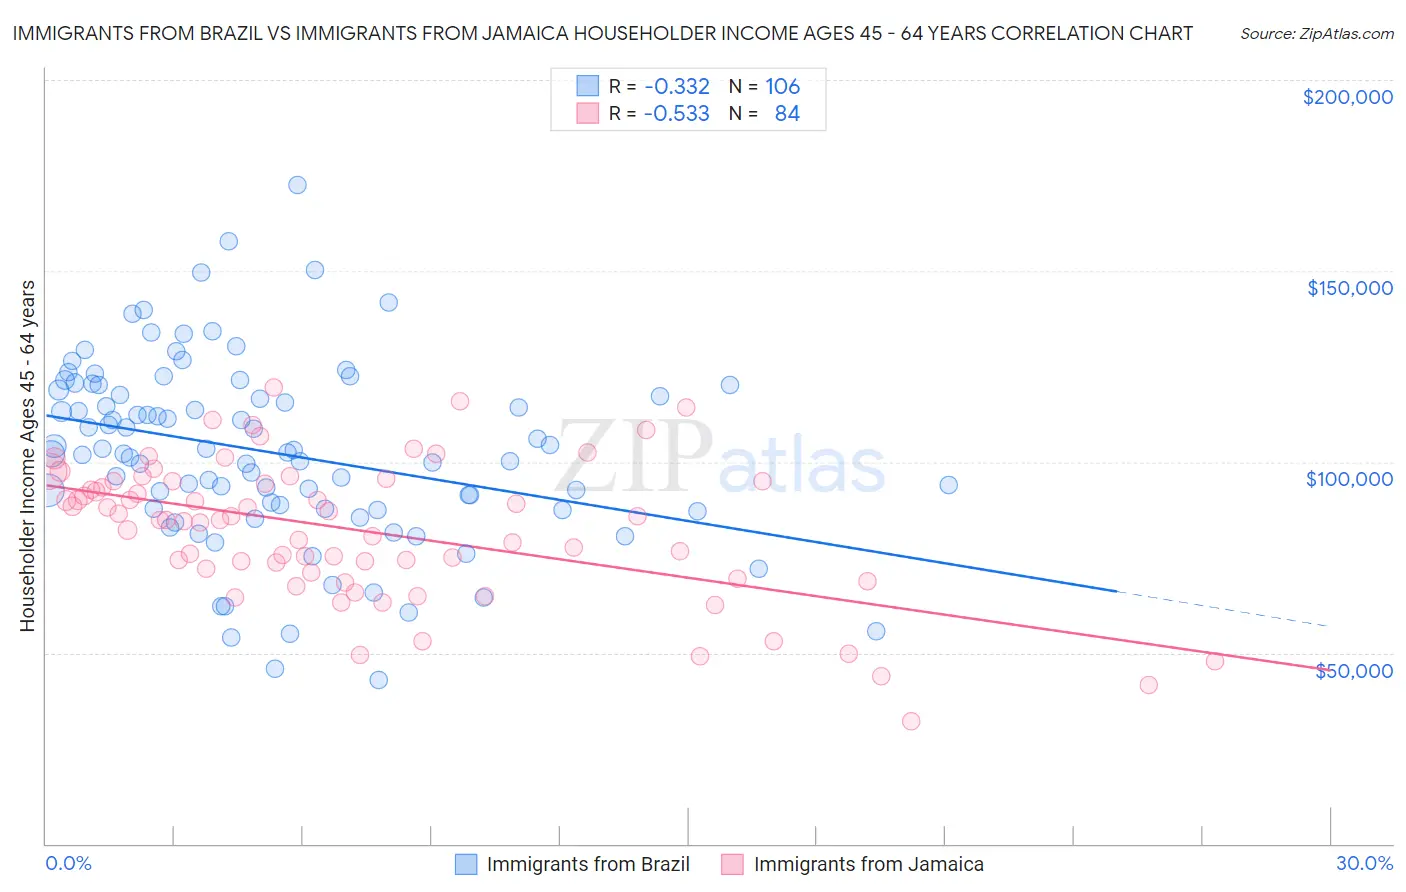
Immigrants from Brazil vs Immigrants from Jamaica Householder Income Ages 45 - 64 years Correlation Chart
The statistical analysis conducted on geographies consisting of 342,574,187 people shows a mild negative correlation between the proportion of Immigrants from Brazil and household income with householder between the ages 45 and 64 in the United States with a correlation coefficient (R) of -0.332 and weighted average of $106,470. Similarly, the statistical analysis conducted on geographies consisting of 301,245,641 people shows a substantial negative correlation between the proportion of Immigrants from Jamaica and household income with householder between the ages 45 and 64 in the United States with a correlation coefficient (R) of -0.533 and weighted average of $87,035, a difference of 22.3%.
Householder Income Ages 45 - 64 years Correlation Summary
| Measurement | Immigrants from Brazil | Immigrants from Jamaica |
| Minimum | $42,860 | $31,923 |
| Maximum | $172,341 | $119,503 |
| Range | $129,481 | $87,580 |
| Mean | $102,398 | $82,100 |
| Median | $102,298 | $84,769 |
| Interquartile 25% (IQ1) | $87,781 | $71,502 |
| Interquartile 75% (IQ3) | $118,810 | $94,805 |
| Interquartile Range (IQR) | $31,029 | $23,303 |
| Standard Deviation (Sample) | $24,082 | $18,162 |
| Standard Deviation (Population) | $23,969 | $18,054 |
Similar Demographics by Householder Income Ages 45 - 64 years
Demographics Similar to Immigrants from Brazil by Householder Income Ages 45 - 64 years
In terms of householder income ages 45 - 64 years, the demographic groups most similar to Immigrants from Brazil are Immigrants from Vietnam ($106,417, a difference of 0.050%), Swedish ($106,377, a difference of 0.090%), European ($106,367, a difference of 0.10%), Chilean ($106,611, a difference of 0.13%), and Immigrants from Poland ($106,319, a difference of 0.14%).
| Demographics | Rating | Rank | Householder Income Ages 45 - 64 years |
| Syrians | 96.9 /100 | #103 | Exceptional $107,207 |
| Immigrants | Ukraine | 96.7 /100 | #104 | Exceptional $107,079 |
| Macedonians | 96.7 /100 | #105 | Exceptional $107,074 |
| Armenians | 96.6 /100 | #106 | Exceptional $107,002 |
| Immigrants | Fiji | 96.5 /100 | #107 | Exceptional $106,952 |
| Zimbabweans | 96.3 /100 | #108 | Exceptional $106,849 |
| Chileans | 95.9 /100 | #109 | Exceptional $106,611 |
| Immigrants | Brazil | 95.6 /100 | #110 | Exceptional $106,470 |
| Immigrants | Vietnam | 95.5 /100 | #111 | Exceptional $106,417 |
| Swedes | 95.4 /100 | #112 | Exceptional $106,377 |
| Europeans | 95.4 /100 | #113 | Exceptional $106,367 |
| Immigrants | Poland | 95.3 /100 | #114 | Exceptional $106,319 |
| Immigrants | Kuwait | 95.2 /100 | #115 | Exceptional $106,285 |
| British | 95.2 /100 | #116 | Exceptional $106,264 |
| Albanians | 95.1 /100 | #117 | Exceptional $106,243 |
Demographics Similar to Immigrants from Jamaica by Householder Income Ages 45 - 64 years
In terms of householder income ages 45 - 64 years, the demographic groups most similar to Immigrants from Jamaica are Yakama ($86,992, a difference of 0.050%), Immigrants from Somalia ($86,987, a difference of 0.050%), Yaqui ($86,914, a difference of 0.14%), Senegalese ($86,897, a difference of 0.16%), and Cree ($87,185, a difference of 0.17%).
| Demographics | Rating | Rank | Householder Income Ages 45 - 64 years |
| Guatemalans | 0.2 /100 | #271 | Tragic $87,705 |
| Cape Verdeans | 0.2 /100 | #272 | Tragic $87,580 |
| Spanish American Indians | 0.2 /100 | #273 | Tragic $87,561 |
| Iroquois | 0.1 /100 | #274 | Tragic $87,255 |
| Immigrants | Belize | 0.1 /100 | #275 | Tragic $87,229 |
| Immigrants | Latin America | 0.1 /100 | #276 | Tragic $87,219 |
| Cree | 0.1 /100 | #277 | Tragic $87,185 |
| Immigrants | Jamaica | 0.1 /100 | #278 | Tragic $87,035 |
| Yakama | 0.1 /100 | #279 | Tragic $86,992 |
| Immigrants | Somalia | 0.1 /100 | #280 | Tragic $86,987 |
| Yaqui | 0.1 /100 | #281 | Tragic $86,914 |
| Senegalese | 0.1 /100 | #282 | Tragic $86,897 |
| Mexicans | 0.1 /100 | #283 | Tragic $86,816 |
| Central American Indians | 0.1 /100 | #284 | Tragic $86,764 |
| Blackfeet | 0.1 /100 | #285 | Tragic $86,595 |