Estonian vs Immigrants from Honduras Householder Income Over 65 years
COMPARE
Estonian
Immigrants from Honduras
Householder Income Over 65 years
Householder Income Over 65 years Comparison
Estonians
Immigrants from Honduras
$67,926
HOUSEHOLDER INCOME OVER 65 YEARS
99.9/ 100
METRIC RATING
38th/ 347
METRIC RANK
$51,888
HOUSEHOLDER INCOME OVER 65 YEARS
0.0/ 100
METRIC RATING
319th/ 347
METRIC RANK
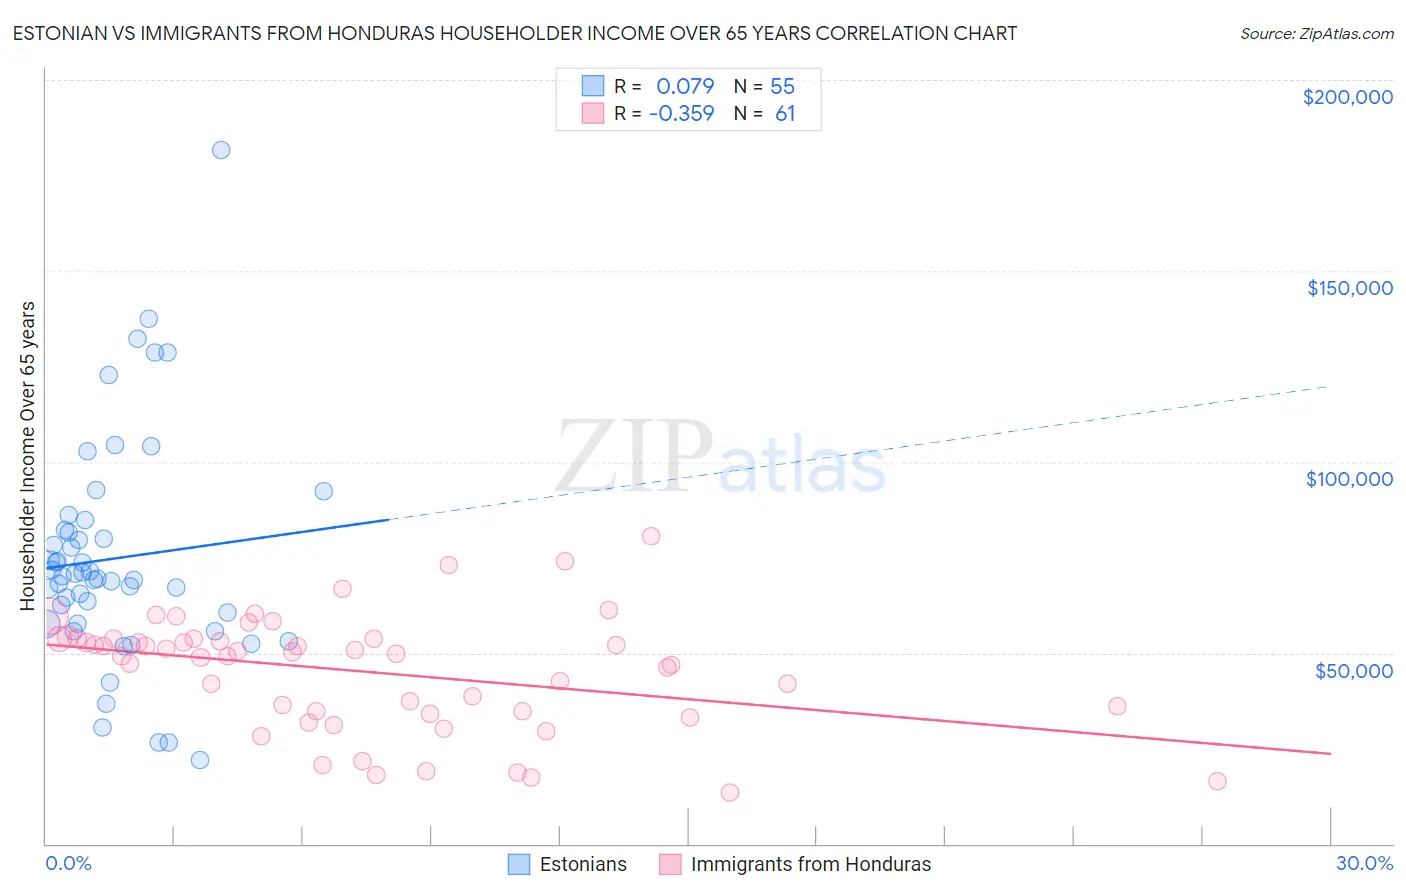
Estonian vs Immigrants from Honduras Householder Income Over 65 years Correlation Chart
The statistical analysis conducted on geographies consisting of 123,423,480 people shows a slight positive correlation between the proportion of Estonians and household income with householder over the age of 65 in the United States with a correlation coefficient (R) of 0.079 and weighted average of $67,926. Similarly, the statistical analysis conducted on geographies consisting of 321,788,463 people shows a mild negative correlation between the proportion of Immigrants from Honduras and household income with householder over the age of 65 in the United States with a correlation coefficient (R) of -0.359 and weighted average of $51,888, a difference of 30.9%.
Householder Income Over 65 years Correlation Summary
| Measurement | Estonian | Immigrants from Honduras |
| Minimum | $21,786 | $13,371 |
| Maximum | $181,719 | $80,682 |
| Range | $159,933 | $67,311 |
| Mean | $74,728 | $45,102 |
| Median | $70,115 | $49,642 |
| Interquartile 25% (IQ1) | $57,743 | $34,344 |
| Interquartile 75% (IQ3) | $82,145 | $53,638 |
| Interquartile Range (IQR) | $24,401 | $19,294 |
| Standard Deviation (Sample) | $29,421 | $15,103 |
| Standard Deviation (Population) | $29,152 | $14,979 |
Similar Demographics by Householder Income Over 65 years
Demographics Similar to Estonians by Householder Income Over 65 years
In terms of householder income over 65 years, the demographic groups most similar to Estonians are Turkish ($68,037, a difference of 0.16%), Immigrants from Austria ($68,208, a difference of 0.42%), Russian ($67,626, a difference of 0.44%), Tongan ($68,235, a difference of 0.46%), and Immigrants from Asia ($67,594, a difference of 0.49%).
| Demographics | Rating | Rank | Householder Income Over 65 years |
| Afghans | 100.0 /100 | #31 | Exceptional $68,951 |
| Asians | 100.0 /100 | #32 | Exceptional $68,822 |
| Immigrants | Denmark | 100.0 /100 | #33 | Exceptional $68,801 |
| Immigrants | Ireland | 100.0 /100 | #34 | Exceptional $68,495 |
| Tongans | 100.0 /100 | #35 | Exceptional $68,235 |
| Immigrants | Austria | 99.9 /100 | #36 | Exceptional $68,208 |
| Turks | 99.9 /100 | #37 | Exceptional $68,037 |
| Estonians | 99.9 /100 | #38 | Exceptional $67,926 |
| Russians | 99.9 /100 | #39 | Exceptional $67,626 |
| Immigrants | Asia | 99.9 /100 | #40 | Exceptional $67,594 |
| Koreans | 99.9 /100 | #41 | Exceptional $67,472 |
| New Zealanders | 99.9 /100 | #42 | Exceptional $67,333 |
| Latvians | 99.9 /100 | #43 | Exceptional $67,326 |
| Immigrants | South Africa | 99.9 /100 | #44 | Exceptional $67,234 |
| Immigrants | Afghanistan | 99.8 /100 | #45 | Exceptional $67,007 |
Demographics Similar to Immigrants from Honduras by Householder Income Over 65 years
In terms of householder income over 65 years, the demographic groups most similar to Immigrants from Honduras are Haitian ($51,912, a difference of 0.050%), Immigrants from St. Vincent and the Grenadines ($51,922, a difference of 0.070%), Creek ($51,949, a difference of 0.12%), Colville ($51,739, a difference of 0.29%), and Menominee ($51,719, a difference of 0.33%).
| Demographics | Rating | Rank | Householder Income Over 65 years |
| Immigrants | Azores | 0.0 /100 | #312 | Tragic $52,121 |
| Immigrants | Nicaragua | 0.0 /100 | #313 | Tragic $52,085 |
| Natives/Alaskans | 0.0 /100 | #314 | Tragic $52,081 |
| U.S. Virgin Islanders | 0.0 /100 | #315 | Tragic $52,072 |
| Creek | 0.0 /100 | #316 | Tragic $51,949 |
| Immigrants | St. Vincent and the Grenadines | 0.0 /100 | #317 | Tragic $51,922 |
| Haitians | 0.0 /100 | #318 | Tragic $51,912 |
| Immigrants | Honduras | 0.0 /100 | #319 | Tragic $51,888 |
| Colville | 0.0 /100 | #320 | Tragic $51,739 |
| Menominee | 0.0 /100 | #321 | Tragic $51,719 |
| British West Indians | 0.0 /100 | #322 | Tragic $51,463 |
| Cajuns | 0.0 /100 | #323 | Tragic $51,397 |
| Immigrants | Congo | 0.0 /100 | #324 | Tragic $51,393 |
| Immigrants | Haiti | 0.0 /100 | #325 | Tragic $51,219 |
| Kiowa | 0.0 /100 | #326 | Tragic $51,140 |