Samoan vs Laotian Householder Income Over 65 years
COMPARE
Samoan
Laotian
Householder Income Over 65 years
Householder Income Over 65 years Comparison
Samoans
Laotians
$65,427
HOUSEHOLDER INCOME OVER 65 YEARS
99.1/ 100
METRIC RATING
69th/ 347
METRIC RANK
$66,306
HOUSEHOLDER INCOME OVER 65 YEARS
99.6/ 100
METRIC RATING
56th/ 347
METRIC RANK
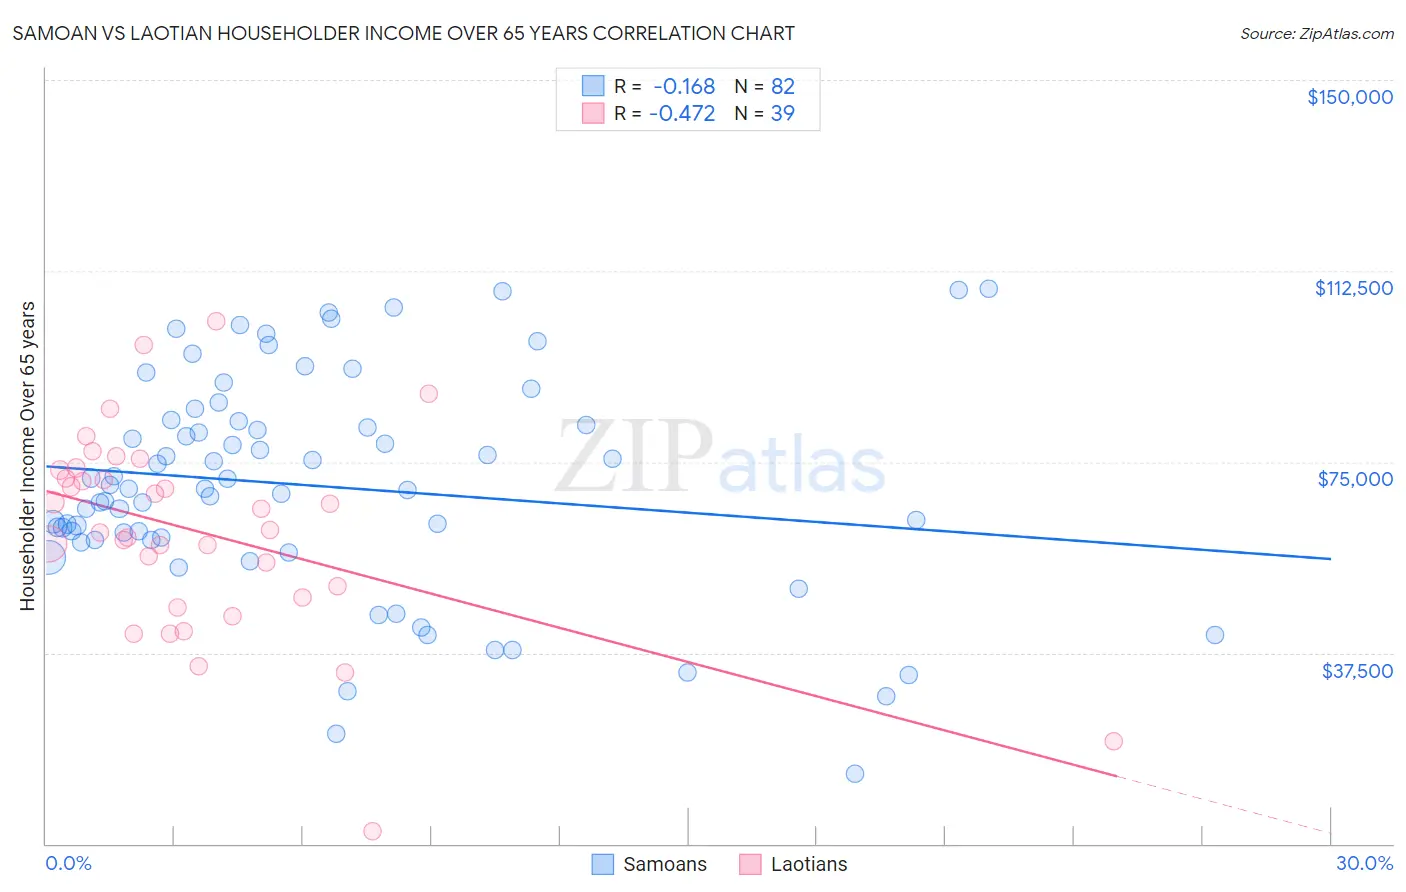
Samoan vs Laotian Householder Income Over 65 years Correlation Chart
The statistical analysis conducted on geographies consisting of 224,404,839 people shows a poor negative correlation between the proportion of Samoans and household income with householder over the age of 65 in the United States with a correlation coefficient (R) of -0.168 and weighted average of $65,427. Similarly, the statistical analysis conducted on geographies consisting of 224,427,715 people shows a moderate negative correlation between the proportion of Laotians and household income with householder over the age of 65 in the United States with a correlation coefficient (R) of -0.472 and weighted average of $66,306, a difference of 1.3%.
Householder Income Over 65 years Correlation Summary
| Measurement | Samoan | Laotian |
| Minimum | $13,651 | $2,499 |
| Maximum | $108,977 | $102,679 |
| Range | $95,326 | $100,180 |
| Mean | $70,206 | $61,254 |
| Median | $69,618 | $61,648 |
| Interquartile 25% (IQ1) | $59,611 | $48,484 |
| Interquartile 75% (IQ3) | $83,086 | $73,311 |
| Interquartile Range (IQR) | $23,475 | $24,827 |
| Standard Deviation (Sample) | $21,405 | $19,839 |
| Standard Deviation (Population) | $21,274 | $19,583 |
Demographics Similar to Samoans and Laotians by Householder Income Over 65 years
In terms of householder income over 65 years, the demographic groups most similar to Samoans are Egyptian ($65,441, a difference of 0.020%), Immigrants from Malaysia ($65,497, a difference of 0.11%), Mongolian ($65,326, a difference of 0.15%), Greek ($65,306, a difference of 0.19%), and Argentinean ($65,246, a difference of 0.28%). Similarly, the demographic groups most similar to Laotians are Immigrants from Czechoslovakia ($66,376, a difference of 0.11%), Bulgarian ($66,236, a difference of 0.11%), Immigrants from Philippines ($66,161, a difference of 0.22%), Immigrants from Netherlands ($66,463, a difference of 0.24%), and Immigrants from Norway ($66,118, a difference of 0.28%).
| Demographics | Rating | Rank | Householder Income Over 65 years |
| Immigrants | Scotland | 99.7 /100 | #52 | Exceptional $66,620 |
| Immigrants | Pakistan | 99.7 /100 | #53 | Exceptional $66,617 |
| Immigrants | Netherlands | 99.7 /100 | #54 | Exceptional $66,463 |
| Immigrants | Czechoslovakia | 99.7 /100 | #55 | Exceptional $66,376 |
| Laotians | 99.6 /100 | #56 | Exceptional $66,306 |
| Bulgarians | 99.6 /100 | #57 | Exceptional $66,236 |
| Immigrants | Philippines | 99.6 /100 | #58 | Exceptional $66,161 |
| Immigrants | Norway | 99.5 /100 | #59 | Exceptional $66,118 |
| Immigrants | Lithuania | 99.5 /100 | #60 | Exceptional $66,087 |
| Maltese | 99.5 /100 | #61 | Exceptional $66,027 |
| Immigrants | Sierra Leone | 99.5 /100 | #62 | Exceptional $66,009 |
| Marshallese | 99.4 /100 | #63 | Exceptional $65,874 |
| Zimbabweans | 99.4 /100 | #64 | Exceptional $65,854 |
| Immigrants | England | 99.3 /100 | #65 | Exceptional $65,715 |
| South Africans | 99.3 /100 | #66 | Exceptional $65,652 |
| Immigrants | Malaysia | 99.1 /100 | #67 | Exceptional $65,497 |
| Egyptians | 99.1 /100 | #68 | Exceptional $65,441 |
| Samoans | 99.1 /100 | #69 | Exceptional $65,427 |
| Mongolians | 99.0 /100 | #70 | Exceptional $65,326 |
| Greeks | 98.9 /100 | #71 | Exceptional $65,306 |
| Argentineans | 98.9 /100 | #72 | Exceptional $65,246 |