Russian vs Immigrants from Canada Householder Income Ages 25 - 44 years
COMPARE
Russian
Immigrants from Canada
Householder Income Ages 25 - 44 years
Householder Income Ages 25 - 44 years Comparison
Russians
Immigrants from Canada
$110,398
HOUSEHOLDER INCOME AGES 25 - 44 YEARS
100.0/ 100
METRIC RATING
27th/ 347
METRIC RANK
$102,616
HOUSEHOLDER INCOME AGES 25 - 44 YEARS
98.9/ 100
METRIC RATING
88th/ 347
METRIC RANK
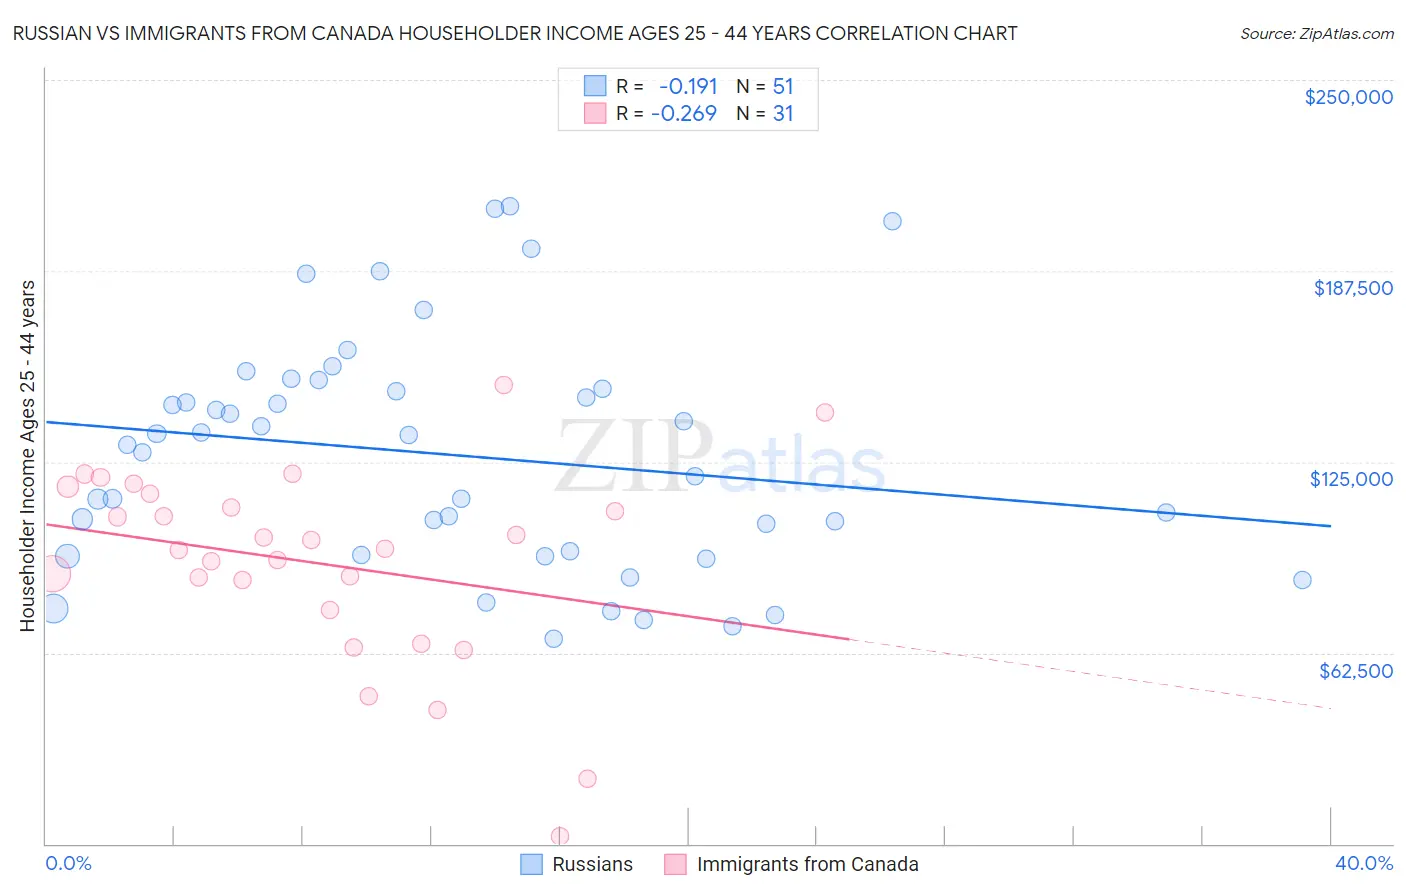
Russian vs Immigrants from Canada Householder Income Ages 25 - 44 years Correlation Chart
The statistical analysis conducted on geographies consisting of 509,334,008 people shows a poor negative correlation between the proportion of Russians and household income with householder between the ages 25 and 44 in the United States with a correlation coefficient (R) of -0.191 and weighted average of $110,398. Similarly, the statistical analysis conducted on geographies consisting of 457,590,817 people shows a weak negative correlation between the proportion of Immigrants from Canada and household income with householder between the ages 25 and 44 in the United States with a correlation coefficient (R) of -0.269 and weighted average of $102,616, a difference of 7.6%.
Householder Income Ages 25 - 44 years Correlation Summary
| Measurement | Russian | Immigrants from Canada |
| Minimum | $66,915 | $2,499 |
| Maximum | $208,545 | $150,179 |
| Range | $141,631 | $147,680 |
| Mean | $127,354 | $91,907 |
| Median | $130,564 | $96,656 |
| Interquartile 25% (IQ1) | $94,322 | $76,535 |
| Interquartile 75% (IQ3) | $149,075 | $114,617 |
| Interquartile Range (IQR) | $54,753 | $38,082 |
| Standard Deviation (Sample) | $37,897 | $32,277 |
| Standard Deviation (Population) | $37,523 | $31,752 |
Similar Demographics by Householder Income Ages 25 - 44 years
Demographics Similar to Russians by Householder Income Ages 25 - 44 years
In terms of householder income ages 25 - 44 years, the demographic groups most similar to Russians are Immigrants from Denmark ($110,363, a difference of 0.030%), Turkish ($110,318, a difference of 0.070%), Immigrants from Greece ($110,103, a difference of 0.27%), Maltese ($110,064, a difference of 0.30%), and Immigrants from Asia ($110,787, a difference of 0.35%).
| Demographics | Rating | Rank | Householder Income Ages 25 - 44 years |
| Immigrants | Korea | 100.0 /100 | #20 | Exceptional $113,401 |
| Asians | 100.0 /100 | #21 | Exceptional $112,666 |
| Immigrants | Belgium | 100.0 /100 | #22 | Exceptional $112,575 |
| Immigrants | Japan | 100.0 /100 | #23 | Exceptional $112,228 |
| Immigrants | Sweden | 100.0 /100 | #24 | Exceptional $112,010 |
| Immigrants | Northern Europe | 100.0 /100 | #25 | Exceptional $111,676 |
| Immigrants | Asia | 100.0 /100 | #26 | Exceptional $110,787 |
| Russians | 100.0 /100 | #27 | Exceptional $110,398 |
| Immigrants | Denmark | 100.0 /100 | #28 | Exceptional $110,363 |
| Turks | 100.0 /100 | #29 | Exceptional $110,318 |
| Immigrants | Greece | 100.0 /100 | #30 | Exceptional $110,103 |
| Maltese | 100.0 /100 | #31 | Exceptional $110,064 |
| Immigrants | Sri Lanka | 100.0 /100 | #32 | Exceptional $109,741 |
| Bhutanese | 100.0 /100 | #33 | Exceptional $109,520 |
| Bolivians | 100.0 /100 | #34 | Exceptional $109,372 |
Demographics Similar to Immigrants from Canada by Householder Income Ages 25 - 44 years
In terms of householder income ages 25 - 44 years, the demographic groups most similar to Immigrants from Canada are Immigrants from Hungary ($102,655, a difference of 0.040%), Immigrants from Western Europe ($102,654, a difference of 0.040%), Immigrants from Ukraine ($102,664, a difference of 0.050%), Romanian ($102,544, a difference of 0.070%), and Ukrainian ($102,451, a difference of 0.16%).
| Demographics | Rating | Rank | Householder Income Ages 25 - 44 years |
| South Africans | 99.2 /100 | #81 | Exceptional $103,160 |
| Immigrants | Serbia | 99.2 /100 | #82 | Exceptional $103,155 |
| Argentineans | 99.1 /100 | #83 | Exceptional $103,111 |
| Immigrants | Philippines | 99.0 /100 | #84 | Exceptional $102,910 |
| Immigrants | Ukraine | 98.9 /100 | #85 | Exceptional $102,664 |
| Immigrants | Hungary | 98.9 /100 | #86 | Exceptional $102,655 |
| Immigrants | Western Europe | 98.9 /100 | #87 | Exceptional $102,654 |
| Immigrants | Canada | 98.9 /100 | #88 | Exceptional $102,616 |
| Romanians | 98.8 /100 | #89 | Exceptional $102,544 |
| Ukrainians | 98.8 /100 | #90 | Exceptional $102,451 |
| Croatians | 98.7 /100 | #91 | Exceptional $102,414 |
| Immigrants | North America | 98.7 /100 | #92 | Exceptional $102,407 |
| Immigrants | England | 98.4 /100 | #93 | Exceptional $102,020 |
| Sri Lankans | 98.4 /100 | #94 | Exceptional $101,960 |
| Assyrians/Chaldeans/Syriacs | 98.3 /100 | #95 | Exceptional $101,936 |