Immigrants from Iran vs Immigrants from Canada Householder Income Ages 25 - 44 years
COMPARE
Immigrants from Iran
Immigrants from Canada
Householder Income Ages 25 - 44 years
Householder Income Ages 25 - 44 years Comparison
Immigrants from Iran
Immigrants from Canada
$119,204
HOUSEHOLDER INCOME AGES 25 - 44 YEARS
100.0/ 100
METRIC RATING
12th/ 347
METRIC RANK
$102,616
HOUSEHOLDER INCOME AGES 25 - 44 YEARS
98.9/ 100
METRIC RATING
88th/ 347
METRIC RANK
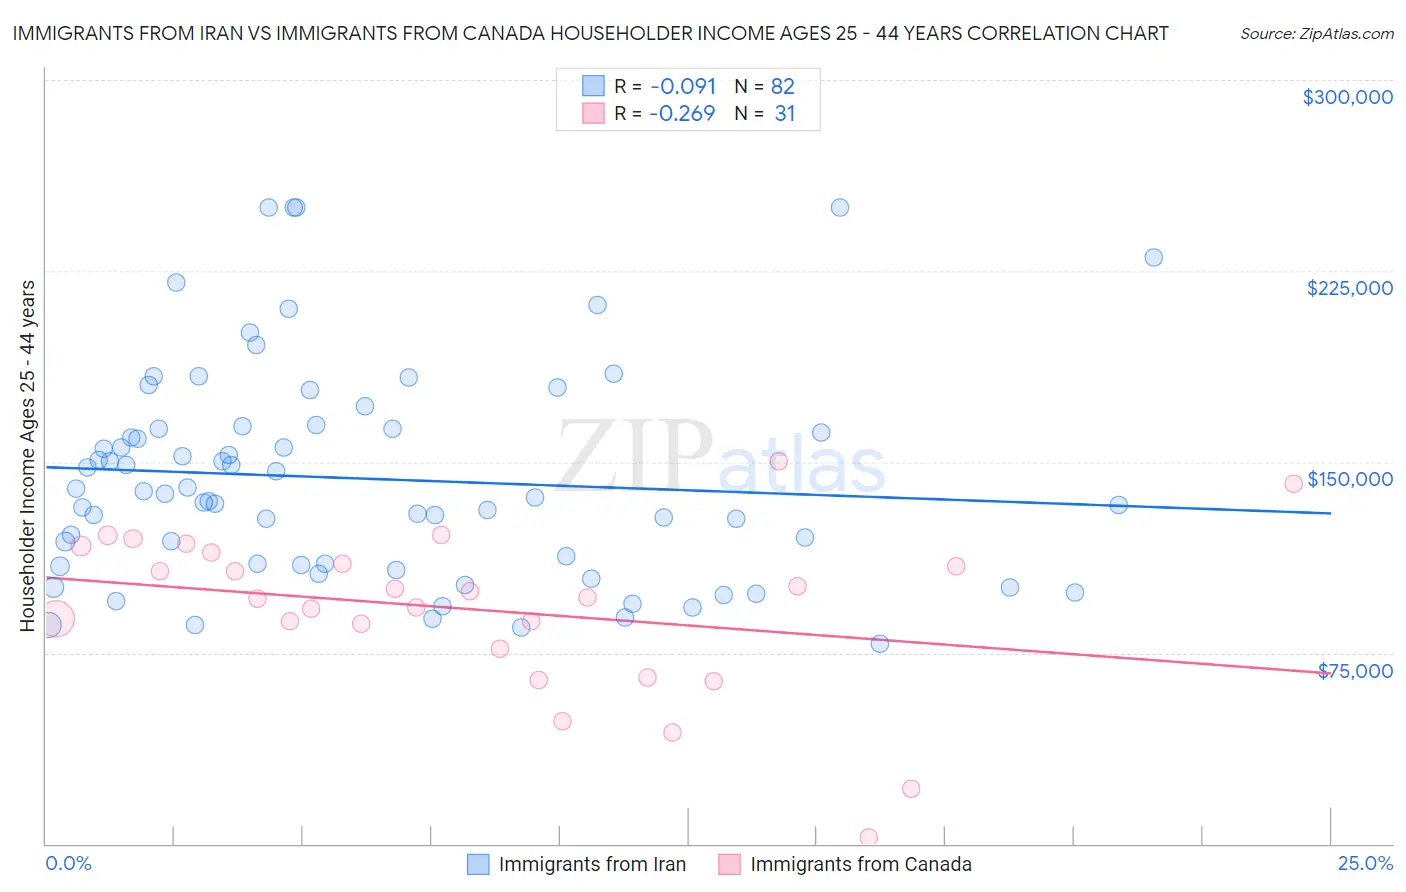
Immigrants from Iran vs Immigrants from Canada Householder Income Ages 25 - 44 years Correlation Chart
The statistical analysis conducted on geographies consisting of 279,573,496 people shows a slight negative correlation between the proportion of Immigrants from Iran and household income with householder between the ages 25 and 44 in the United States with a correlation coefficient (R) of -0.091 and weighted average of $119,204. Similarly, the statistical analysis conducted on geographies consisting of 457,590,817 people shows a weak negative correlation between the proportion of Immigrants from Canada and household income with householder between the ages 25 and 44 in the United States with a correlation coefficient (R) of -0.269 and weighted average of $102,616, a difference of 16.2%.
Householder Income Ages 25 - 44 years Correlation Summary
| Measurement | Immigrants from Iran | Immigrants from Canada |
| Minimum | $78,352 | $2,499 |
| Maximum | $250,001 | $150,179 |
| Range | $171,649 | $147,680 |
| Mean | $143,389 | $91,907 |
| Median | $136,696 | $96,656 |
| Interquartile 25% (IQ1) | $109,520 | $76,535 |
| Interquartile 75% (IQ3) | $163,202 | $114,617 |
| Interquartile Range (IQR) | $53,682 | $38,082 |
| Standard Deviation (Sample) | $42,216 | $32,277 |
| Standard Deviation (Population) | $41,958 | $31,752 |
Similar Demographics by Householder Income Ages 25 - 44 years
Demographics Similar to Immigrants from Iran by Householder Income Ages 25 - 44 years
In terms of householder income ages 25 - 44 years, the demographic groups most similar to Immigrants from Iran are Okinawan ($119,349, a difference of 0.12%), Indian (Asian) ($119,496, a difference of 0.25%), Immigrants from China ($119,756, a difference of 0.46%), Iranian ($120,292, a difference of 0.91%), and Immigrants from Ireland ($120,333, a difference of 0.95%).
| Demographics | Rating | Rank | Householder Income Ages 25 - 44 years |
| Immigrants | India | 100.0 /100 | #5 | Exceptional $124,238 |
| Thais | 100.0 /100 | #6 | Exceptional $121,778 |
| Immigrants | Ireland | 100.0 /100 | #7 | Exceptional $120,333 |
| Iranians | 100.0 /100 | #8 | Exceptional $120,292 |
| Immigrants | China | 100.0 /100 | #9 | Exceptional $119,756 |
| Indians (Asian) | 100.0 /100 | #10 | Exceptional $119,496 |
| Okinawans | 100.0 /100 | #11 | Exceptional $119,349 |
| Immigrants | Iran | 100.0 /100 | #12 | Exceptional $119,204 |
| Immigrants | Eastern Asia | 100.0 /100 | #13 | Exceptional $118,056 |
| Immigrants | Israel | 100.0 /100 | #14 | Exceptional $117,219 |
| Immigrants | South Central Asia | 100.0 /100 | #15 | Exceptional $116,626 |
| Cypriots | 100.0 /100 | #16 | Exceptional $116,364 |
| Immigrants | Australia | 100.0 /100 | #17 | Exceptional $115,947 |
| Eastern Europeans | 100.0 /100 | #18 | Exceptional $114,523 |
| Burmese | 100.0 /100 | #19 | Exceptional $113,701 |
Demographics Similar to Immigrants from Canada by Householder Income Ages 25 - 44 years
In terms of householder income ages 25 - 44 years, the demographic groups most similar to Immigrants from Canada are Immigrants from Hungary ($102,655, a difference of 0.040%), Immigrants from Western Europe ($102,654, a difference of 0.040%), Immigrants from Ukraine ($102,664, a difference of 0.050%), Romanian ($102,544, a difference of 0.070%), and Ukrainian ($102,451, a difference of 0.16%).
| Demographics | Rating | Rank | Householder Income Ages 25 - 44 years |
| South Africans | 99.2 /100 | #81 | Exceptional $103,160 |
| Immigrants | Serbia | 99.2 /100 | #82 | Exceptional $103,155 |
| Argentineans | 99.1 /100 | #83 | Exceptional $103,111 |
| Immigrants | Philippines | 99.0 /100 | #84 | Exceptional $102,910 |
| Immigrants | Ukraine | 98.9 /100 | #85 | Exceptional $102,664 |
| Immigrants | Hungary | 98.9 /100 | #86 | Exceptional $102,655 |
| Immigrants | Western Europe | 98.9 /100 | #87 | Exceptional $102,654 |
| Immigrants | Canada | 98.9 /100 | #88 | Exceptional $102,616 |
| Romanians | 98.8 /100 | #89 | Exceptional $102,544 |
| Ukrainians | 98.8 /100 | #90 | Exceptional $102,451 |
| Croatians | 98.7 /100 | #91 | Exceptional $102,414 |
| Immigrants | North America | 98.7 /100 | #92 | Exceptional $102,407 |
| Immigrants | England | 98.4 /100 | #93 | Exceptional $102,020 |
| Sri Lankans | 98.4 /100 | #94 | Exceptional $101,960 |
| Assyrians/Chaldeans/Syriacs | 98.3 /100 | #95 | Exceptional $101,936 |