Ecuadorian vs Immigrants from Canada Householder Income Ages 25 - 44 years
COMPARE
Ecuadorian
Immigrants from Canada
Householder Income Ages 25 - 44 years
Householder Income Ages 25 - 44 years Comparison
Ecuadorians
Immigrants from Canada
$91,574
HOUSEHOLDER INCOME AGES 25 - 44 YEARS
16.0/ 100
METRIC RATING
202nd/ 347
METRIC RANK
$102,616
HOUSEHOLDER INCOME AGES 25 - 44 YEARS
98.9/ 100
METRIC RATING
88th/ 347
METRIC RANK
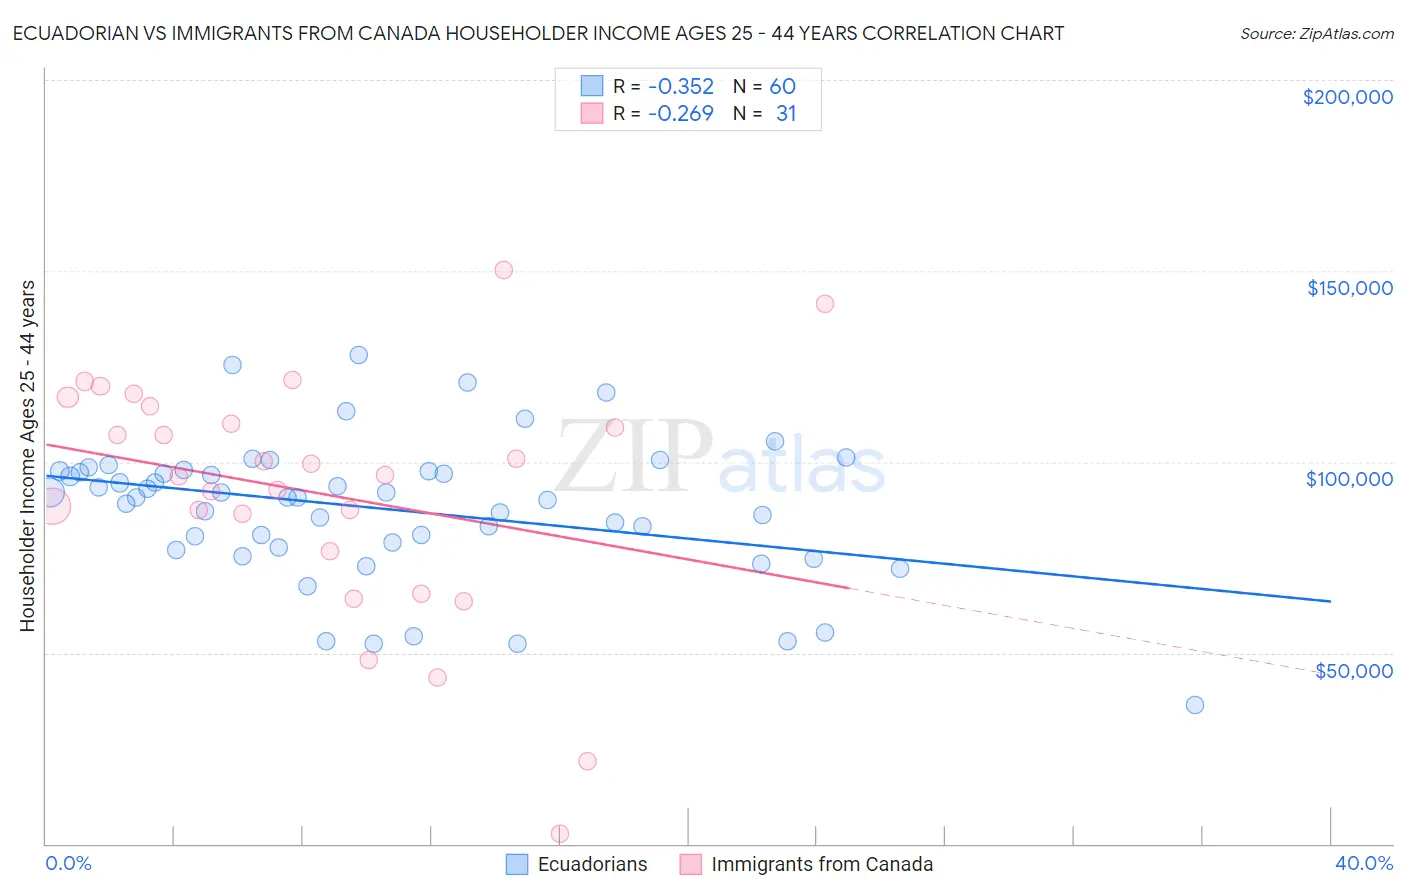
Ecuadorian vs Immigrants from Canada Householder Income Ages 25 - 44 years Correlation Chart
The statistical analysis conducted on geographies consisting of 317,341,499 people shows a mild negative correlation between the proportion of Ecuadorians and household income with householder between the ages 25 and 44 in the United States with a correlation coefficient (R) of -0.352 and weighted average of $91,574. Similarly, the statistical analysis conducted on geographies consisting of 457,590,817 people shows a weak negative correlation between the proportion of Immigrants from Canada and household income with householder between the ages 25 and 44 in the United States with a correlation coefficient (R) of -0.269 and weighted average of $102,616, a difference of 12.1%.
Householder Income Ages 25 - 44 years Correlation Summary
| Measurement | Ecuadorian | Immigrants from Canada |
| Minimum | $36,176 | $2,499 |
| Maximum | $127,966 | $150,179 |
| Range | $91,790 | $147,680 |
| Mean | $87,639 | $91,907 |
| Median | $90,671 | $96,656 |
| Interquartile 25% (IQ1) | $78,277 | $76,535 |
| Interquartile 75% (IQ3) | $97,520 | $114,617 |
| Interquartile Range (IQR) | $19,243 | $38,082 |
| Standard Deviation (Sample) | $18,484 | $32,277 |
| Standard Deviation (Population) | $18,329 | $31,752 |
Similar Demographics by Householder Income Ages 25 - 44 years
Demographics Similar to Ecuadorians by Householder Income Ages 25 - 44 years
In terms of householder income ages 25 - 44 years, the demographic groups most similar to Ecuadorians are Immigrants from Cambodia ($91,533, a difference of 0.040%), Japanese ($91,624, a difference of 0.050%), Nepalese ($91,498, a difference of 0.080%), White/Caucasian ($91,668, a difference of 0.10%), and Kenyan ($91,684, a difference of 0.12%).
| Demographics | Rating | Rank | Householder Income Ages 25 - 44 years |
| Celtics | 21.6 /100 | #195 | Fair $92,241 |
| Immigrants | Colombia | 21.3 /100 | #196 | Fair $92,204 |
| Spanish | 21.2 /100 | #197 | Fair $92,200 |
| Vietnamese | 20.2 /100 | #198 | Fair $92,089 |
| Kenyans | 16.8 /100 | #199 | Poor $91,684 |
| Whites/Caucasians | 16.7 /100 | #200 | Poor $91,668 |
| Japanese | 16.4 /100 | #201 | Poor $91,624 |
| Ecuadorians | 16.0 /100 | #202 | Poor $91,574 |
| Immigrants | Cambodia | 15.7 /100 | #203 | Poor $91,533 |
| Nepalese | 15.4 /100 | #204 | Poor $91,498 |
| Immigrants | Eastern Africa | 15.2 /100 | #205 | Poor $91,458 |
| Aleuts | 14.5 /100 | #206 | Poor $91,370 |
| Yugoslavians | 14.5 /100 | #207 | Poor $91,368 |
| Immigrants | Thailand | 14.3 /100 | #208 | Poor $91,337 |
| Immigrants | Uruguay | 13.2 /100 | #209 | Poor $91,171 |
Demographics Similar to Immigrants from Canada by Householder Income Ages 25 - 44 years
In terms of householder income ages 25 - 44 years, the demographic groups most similar to Immigrants from Canada are Immigrants from Hungary ($102,655, a difference of 0.040%), Immigrants from Western Europe ($102,654, a difference of 0.040%), Immigrants from Ukraine ($102,664, a difference of 0.050%), Romanian ($102,544, a difference of 0.070%), and Ukrainian ($102,451, a difference of 0.16%).
| Demographics | Rating | Rank | Householder Income Ages 25 - 44 years |
| South Africans | 99.2 /100 | #81 | Exceptional $103,160 |
| Immigrants | Serbia | 99.2 /100 | #82 | Exceptional $103,155 |
| Argentineans | 99.1 /100 | #83 | Exceptional $103,111 |
| Immigrants | Philippines | 99.0 /100 | #84 | Exceptional $102,910 |
| Immigrants | Ukraine | 98.9 /100 | #85 | Exceptional $102,664 |
| Immigrants | Hungary | 98.9 /100 | #86 | Exceptional $102,655 |
| Immigrants | Western Europe | 98.9 /100 | #87 | Exceptional $102,654 |
| Immigrants | Canada | 98.9 /100 | #88 | Exceptional $102,616 |
| Romanians | 98.8 /100 | #89 | Exceptional $102,544 |
| Ukrainians | 98.8 /100 | #90 | Exceptional $102,451 |
| Croatians | 98.7 /100 | #91 | Exceptional $102,414 |
| Immigrants | North America | 98.7 /100 | #92 | Exceptional $102,407 |
| Immigrants | England | 98.4 /100 | #93 | Exceptional $102,020 |
| Sri Lankans | 98.4 /100 | #94 | Exceptional $101,960 |
| Assyrians/Chaldeans/Syriacs | 98.3 /100 | #95 | Exceptional $101,936 |