Russian vs Immigrants from Honduras Householder Income Ages 25 - 44 years
COMPARE
Russian
Immigrants from Honduras
Householder Income Ages 25 - 44 years
Householder Income Ages 25 - 44 years Comparison
Russians
Immigrants from Honduras
$110,398
HOUSEHOLDER INCOME AGES 25 - 44 YEARS
100.0/ 100
METRIC RATING
27th/ 347
METRIC RANK
$77,328
HOUSEHOLDER INCOME AGES 25 - 44 YEARS
0.0/ 100
METRIC RATING
323rd/ 347
METRIC RANK
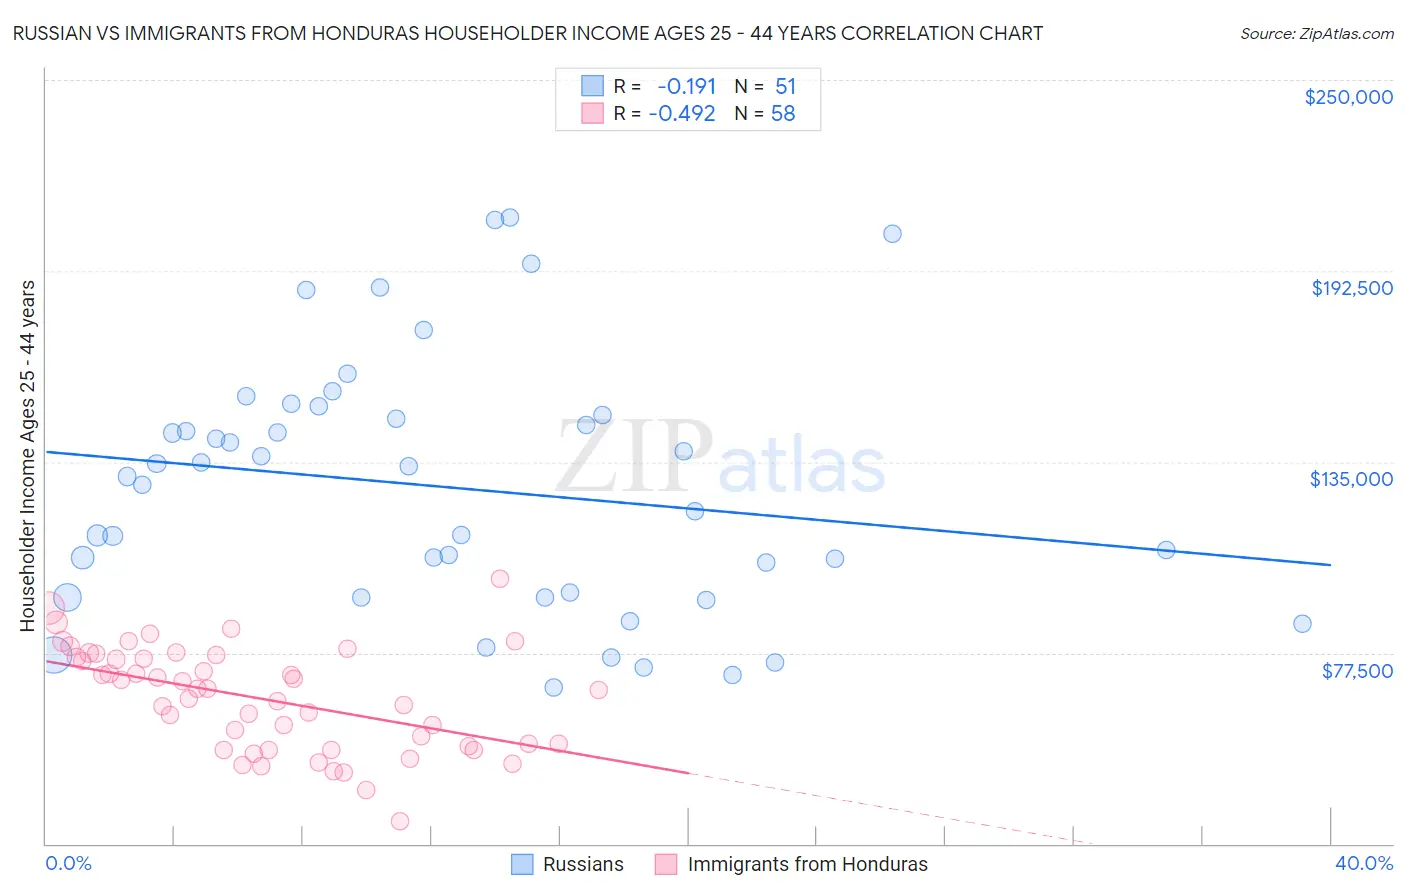
Russian vs Immigrants from Honduras Householder Income Ages 25 - 44 years Correlation Chart
The statistical analysis conducted on geographies consisting of 509,334,008 people shows a poor negative correlation between the proportion of Russians and household income with householder between the ages 25 and 44 in the United States with a correlation coefficient (R) of -0.191 and weighted average of $110,398. Similarly, the statistical analysis conducted on geographies consisting of 321,952,844 people shows a moderate negative correlation between the proportion of Immigrants from Honduras and household income with householder between the ages 25 and 44 in the United States with a correlation coefficient (R) of -0.492 and weighted average of $77,328, a difference of 42.8%.
Householder Income Ages 25 - 44 years Correlation Summary
| Measurement | Russian | Immigrants from Honduras |
| Minimum | $66,915 | $26,956 |
| Maximum | $208,545 | $99,657 |
| Range | $141,631 | $72,701 |
| Mean | $127,354 | $63,676 |
| Median | $130,564 | $66,366 |
| Interquartile 25% (IQ1) | $94,322 | $49,234 |
| Interquartile 75% (IQ3) | $149,075 | $76,183 |
| Interquartile Range (IQR) | $54,753 | $26,949 |
| Standard Deviation (Sample) | $37,897 | $15,519 |
| Standard Deviation (Population) | $37,523 | $15,385 |
Similar Demographics by Householder Income Ages 25 - 44 years
Demographics Similar to Russians by Householder Income Ages 25 - 44 years
In terms of householder income ages 25 - 44 years, the demographic groups most similar to Russians are Immigrants from Denmark ($110,363, a difference of 0.030%), Turkish ($110,318, a difference of 0.070%), Immigrants from Greece ($110,103, a difference of 0.27%), Maltese ($110,064, a difference of 0.30%), and Immigrants from Asia ($110,787, a difference of 0.35%).
| Demographics | Rating | Rank | Householder Income Ages 25 - 44 years |
| Immigrants | Korea | 100.0 /100 | #20 | Exceptional $113,401 |
| Asians | 100.0 /100 | #21 | Exceptional $112,666 |
| Immigrants | Belgium | 100.0 /100 | #22 | Exceptional $112,575 |
| Immigrants | Japan | 100.0 /100 | #23 | Exceptional $112,228 |
| Immigrants | Sweden | 100.0 /100 | #24 | Exceptional $112,010 |
| Immigrants | Northern Europe | 100.0 /100 | #25 | Exceptional $111,676 |
| Immigrants | Asia | 100.0 /100 | #26 | Exceptional $110,787 |
| Russians | 100.0 /100 | #27 | Exceptional $110,398 |
| Immigrants | Denmark | 100.0 /100 | #28 | Exceptional $110,363 |
| Turks | 100.0 /100 | #29 | Exceptional $110,318 |
| Immigrants | Greece | 100.0 /100 | #30 | Exceptional $110,103 |
| Maltese | 100.0 /100 | #31 | Exceptional $110,064 |
| Immigrants | Sri Lanka | 100.0 /100 | #32 | Exceptional $109,741 |
| Bhutanese | 100.0 /100 | #33 | Exceptional $109,520 |
| Bolivians | 100.0 /100 | #34 | Exceptional $109,372 |
Demographics Similar to Immigrants from Honduras by Householder Income Ages 25 - 44 years
In terms of householder income ages 25 - 44 years, the demographic groups most similar to Immigrants from Honduras are Dutch West Indian ($77,260, a difference of 0.090%), Sioux ($77,089, a difference of 0.31%), Houma ($77,044, a difference of 0.37%), Immigrants from Bahamas ($76,910, a difference of 0.54%), and Chickasaw ($77,929, a difference of 0.78%).
| Demographics | Rating | Rank | Householder Income Ages 25 - 44 years |
| Africans | 0.0 /100 | #316 | Tragic $78,986 |
| U.S. Virgin Islanders | 0.0 /100 | #317 | Tragic $78,911 |
| Immigrants | Mexico | 0.0 /100 | #318 | Tragic $78,809 |
| Hondurans | 0.0 /100 | #319 | Tragic $78,540 |
| Choctaw | 0.0 /100 | #320 | Tragic $78,168 |
| Immigrants | Zaire | 0.0 /100 | #321 | Tragic $78,045 |
| Chickasaw | 0.0 /100 | #322 | Tragic $77,929 |
| Immigrants | Honduras | 0.0 /100 | #323 | Tragic $77,328 |
| Dutch West Indians | 0.0 /100 | #324 | Tragic $77,260 |
| Sioux | 0.0 /100 | #325 | Tragic $77,089 |
| Houma | 0.0 /100 | #326 | Tragic $77,044 |
| Immigrants | Bahamas | 0.0 /100 | #327 | Tragic $76,910 |
| Immigrants | Cuba | 0.0 /100 | #328 | Tragic $76,701 |
| Seminole | 0.0 /100 | #329 | Tragic $76,584 |
| Yakama | 0.0 /100 | #330 | Tragic $76,226 |