Russian vs Arab Householder Income Ages 25 - 44 years
COMPARE
Russian
Arab
Householder Income Ages 25 - 44 years
Householder Income Ages 25 - 44 years Comparison
Russians
Arabs
$110,398
HOUSEHOLDER INCOME AGES 25 - 44 YEARS
100.0/ 100
METRIC RATING
27th/ 347
METRIC RANK
$97,336
HOUSEHOLDER INCOME AGES 25 - 44 YEARS
82.3/ 100
METRIC RATING
138th/ 347
METRIC RANK
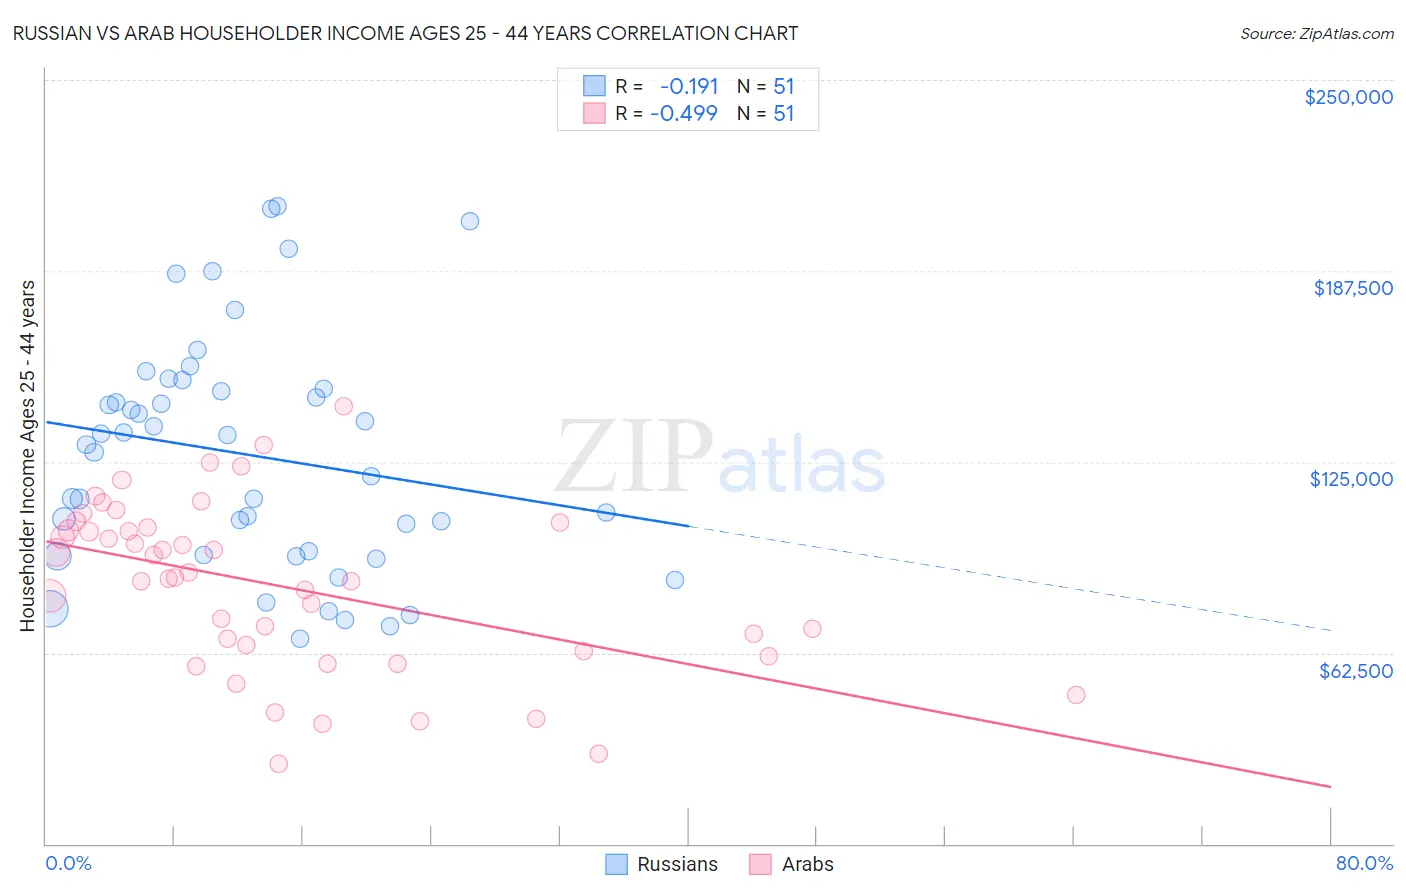
Russian vs Arab Householder Income Ages 25 - 44 years Correlation Chart
The statistical analysis conducted on geographies consisting of 509,334,008 people shows a poor negative correlation between the proportion of Russians and household income with householder between the ages 25 and 44 in the United States with a correlation coefficient (R) of -0.191 and weighted average of $110,398. Similarly, the statistical analysis conducted on geographies consisting of 484,835,242 people shows a moderate negative correlation between the proportion of Arabs and household income with householder between the ages 25 and 44 in the United States with a correlation coefficient (R) of -0.499 and weighted average of $97,336, a difference of 13.4%.
Householder Income Ages 25 - 44 years Correlation Summary
| Measurement | Russian | Arab |
| Minimum | $66,915 | $26,250 |
| Maximum | $208,545 | $143,125 |
| Range | $141,631 | $116,875 |
| Mean | $127,354 | $84,482 |
| Median | $130,564 | $87,286 |
| Interquartile 25% (IQ1) | $94,322 | $63,008 |
| Interquartile 75% (IQ3) | $149,075 | $103,414 |
| Interquartile Range (IQR) | $54,753 | $40,406 |
| Standard Deviation (Sample) | $37,897 | $27,531 |
| Standard Deviation (Population) | $37,523 | $27,260 |
Similar Demographics by Householder Income Ages 25 - 44 years
Demographics Similar to Russians by Householder Income Ages 25 - 44 years
In terms of householder income ages 25 - 44 years, the demographic groups most similar to Russians are Immigrants from Denmark ($110,363, a difference of 0.030%), Turkish ($110,318, a difference of 0.070%), Immigrants from Greece ($110,103, a difference of 0.27%), Maltese ($110,064, a difference of 0.30%), and Immigrants from Asia ($110,787, a difference of 0.35%).
| Demographics | Rating | Rank | Householder Income Ages 25 - 44 years |
| Immigrants | Korea | 100.0 /100 | #20 | Exceptional $113,401 |
| Asians | 100.0 /100 | #21 | Exceptional $112,666 |
| Immigrants | Belgium | 100.0 /100 | #22 | Exceptional $112,575 |
| Immigrants | Japan | 100.0 /100 | #23 | Exceptional $112,228 |
| Immigrants | Sweden | 100.0 /100 | #24 | Exceptional $112,010 |
| Immigrants | Northern Europe | 100.0 /100 | #25 | Exceptional $111,676 |
| Immigrants | Asia | 100.0 /100 | #26 | Exceptional $110,787 |
| Russians | 100.0 /100 | #27 | Exceptional $110,398 |
| Immigrants | Denmark | 100.0 /100 | #28 | Exceptional $110,363 |
| Turks | 100.0 /100 | #29 | Exceptional $110,318 |
| Immigrants | Greece | 100.0 /100 | #30 | Exceptional $110,103 |
| Maltese | 100.0 /100 | #31 | Exceptional $110,064 |
| Immigrants | Sri Lanka | 100.0 /100 | #32 | Exceptional $109,741 |
| Bhutanese | 100.0 /100 | #33 | Exceptional $109,520 |
| Bolivians | 100.0 /100 | #34 | Exceptional $109,372 |
Demographics Similar to Arabs by Householder Income Ages 25 - 44 years
In terms of householder income ages 25 - 44 years, the demographic groups most similar to Arabs are Lebanese ($97,339, a difference of 0.0%), Immigrants from Peru ($97,329, a difference of 0.010%), Immigrants from Morocco ($97,305, a difference of 0.030%), Luxembourger ($97,237, a difference of 0.10%), and Danish ($97,221, a difference of 0.12%).
| Demographics | Rating | Rank | Householder Income Ages 25 - 44 years |
| Immigrants | Albania | 86.6 /100 | #131 | Excellent $97,929 |
| Immigrants | Zimbabwe | 86.3 /100 | #132 | Excellent $97,880 |
| Tsimshian | 85.8 /100 | #133 | Excellent $97,809 |
| Canadians | 84.5 /100 | #134 | Excellent $97,625 |
| Immigrants | Oceania | 84.5 /100 | #135 | Excellent $97,623 |
| Hungarians | 83.9 /100 | #136 | Excellent $97,544 |
| Lebanese | 82.3 /100 | #137 | Excellent $97,339 |
| Arabs | 82.3 /100 | #138 | Excellent $97,336 |
| Immigrants | Peru | 82.2 /100 | #139 | Excellent $97,329 |
| Immigrants | Morocco | 82.0 /100 | #140 | Excellent $97,305 |
| Luxembourgers | 81.5 /100 | #141 | Excellent $97,237 |
| Danes | 81.3 /100 | #142 | Excellent $97,221 |
| Immigrants | Jordan | 81.0 /100 | #143 | Excellent $97,185 |
| Immigrants | Chile | 80.8 /100 | #144 | Excellent $97,159 |
| Norwegians | 78.2 /100 | #145 | Good $96,866 |