Russian vs Immigrants from Cabo Verde Householder Income Ages 25 - 44 years
COMPARE
Russian
Immigrants from Cabo Verde
Householder Income Ages 25 - 44 years
Householder Income Ages 25 - 44 years Comparison
Russians
Immigrants from Cabo Verde
$110,398
HOUSEHOLDER INCOME AGES 25 - 44 YEARS
100.0/ 100
METRIC RATING
27th/ 347
METRIC RANK
$84,304
HOUSEHOLDER INCOME AGES 25 - 44 YEARS
0.3/ 100
METRIC RATING
266th/ 347
METRIC RANK
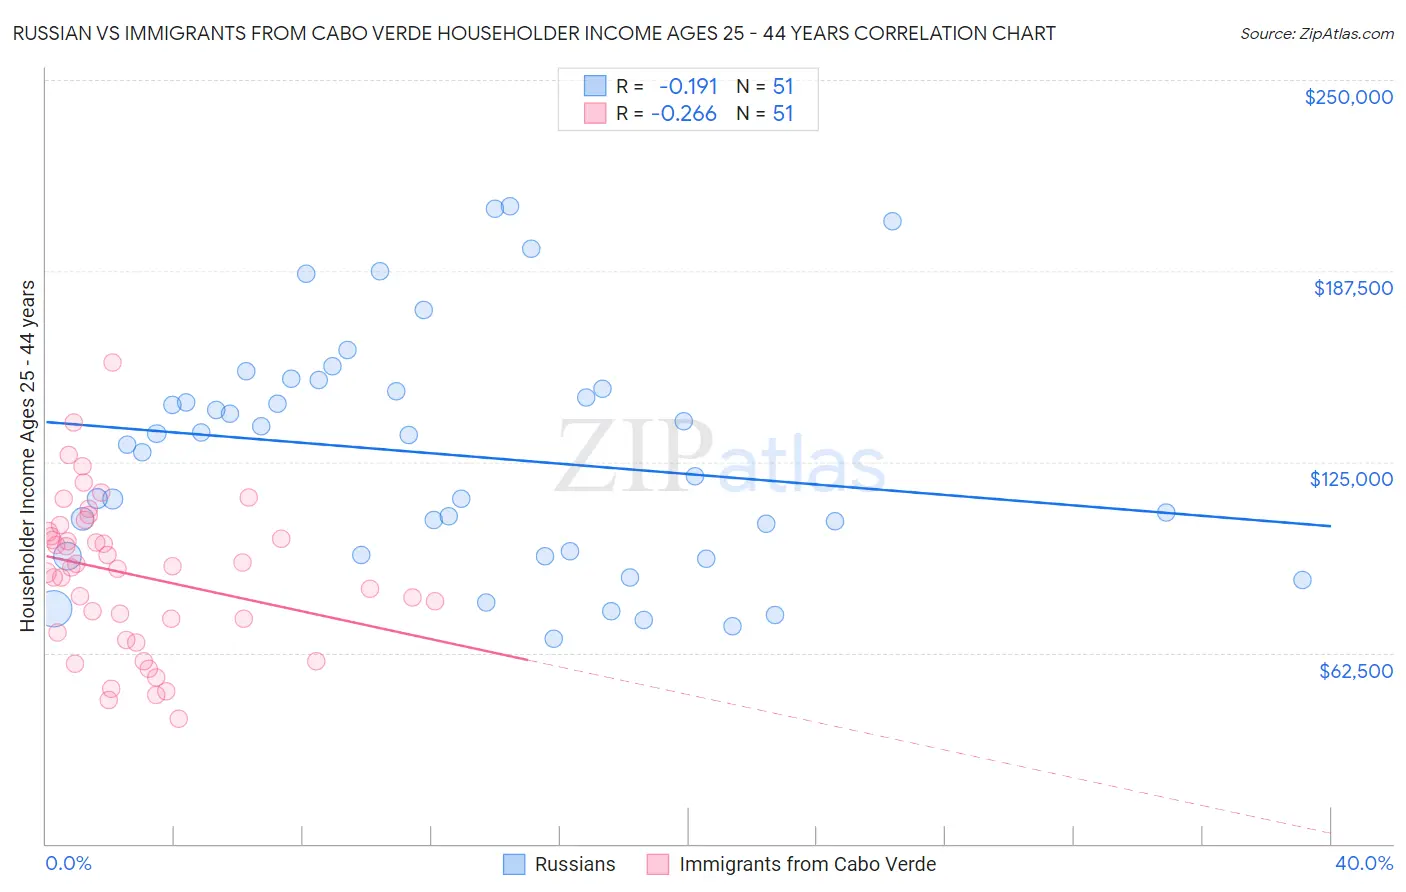
Russian vs Immigrants from Cabo Verde Householder Income Ages 25 - 44 years Correlation Chart
The statistical analysis conducted on geographies consisting of 509,334,008 people shows a poor negative correlation between the proportion of Russians and household income with householder between the ages 25 and 44 in the United States with a correlation coefficient (R) of -0.191 and weighted average of $110,398. Similarly, the statistical analysis conducted on geographies consisting of 38,130,203 people shows a weak negative correlation between the proportion of Immigrants from Cabo Verde and household income with householder between the ages 25 and 44 in the United States with a correlation coefficient (R) of -0.266 and weighted average of $84,304, a difference of 30.9%.
Householder Income Ages 25 - 44 years Correlation Summary
| Measurement | Russian | Immigrants from Cabo Verde |
| Minimum | $66,915 | $41,033 |
| Maximum | $208,545 | $157,447 |
| Range | $141,631 | $116,414 |
| Mean | $127,354 | $88,098 |
| Median | $130,564 | $90,262 |
| Interquartile 25% (IQ1) | $94,322 | $68,956 |
| Interquartile 75% (IQ3) | $149,075 | $102,154 |
| Interquartile Range (IQR) | $54,753 | $33,198 |
| Standard Deviation (Sample) | $37,897 | $24,804 |
| Standard Deviation (Population) | $37,523 | $24,559 |
Similar Demographics by Householder Income Ages 25 - 44 years
Demographics Similar to Russians by Householder Income Ages 25 - 44 years
In terms of householder income ages 25 - 44 years, the demographic groups most similar to Russians are Immigrants from Denmark ($110,363, a difference of 0.030%), Turkish ($110,318, a difference of 0.070%), Immigrants from Greece ($110,103, a difference of 0.27%), Maltese ($110,064, a difference of 0.30%), and Immigrants from Asia ($110,787, a difference of 0.35%).
| Demographics | Rating | Rank | Householder Income Ages 25 - 44 years |
| Immigrants | Korea | 100.0 /100 | #20 | Exceptional $113,401 |
| Asians | 100.0 /100 | #21 | Exceptional $112,666 |
| Immigrants | Belgium | 100.0 /100 | #22 | Exceptional $112,575 |
| Immigrants | Japan | 100.0 /100 | #23 | Exceptional $112,228 |
| Immigrants | Sweden | 100.0 /100 | #24 | Exceptional $112,010 |
| Immigrants | Northern Europe | 100.0 /100 | #25 | Exceptional $111,676 |
| Immigrants | Asia | 100.0 /100 | #26 | Exceptional $110,787 |
| Russians | 100.0 /100 | #27 | Exceptional $110,398 |
| Immigrants | Denmark | 100.0 /100 | #28 | Exceptional $110,363 |
| Turks | 100.0 /100 | #29 | Exceptional $110,318 |
| Immigrants | Greece | 100.0 /100 | #30 | Exceptional $110,103 |
| Maltese | 100.0 /100 | #31 | Exceptional $110,064 |
| Immigrants | Sri Lanka | 100.0 /100 | #32 | Exceptional $109,741 |
| Bhutanese | 100.0 /100 | #33 | Exceptional $109,520 |
| Bolivians | 100.0 /100 | #34 | Exceptional $109,372 |
Demographics Similar to Immigrants from Cabo Verde by Householder Income Ages 25 - 44 years
In terms of householder income ages 25 - 44 years, the demographic groups most similar to Immigrants from Cabo Verde are Hmong ($84,258, a difference of 0.050%), Subsaharan African ($84,235, a difference of 0.080%), Sudanese ($84,401, a difference of 0.12%), Osage ($84,461, a difference of 0.19%), and Spanish American Indian ($84,085, a difference of 0.26%).
| Demographics | Rating | Rank | Householder Income Ages 25 - 44 years |
| Immigrants | Senegal | 0.5 /100 | #259 | Tragic $84,848 |
| Americans | 0.4 /100 | #260 | Tragic $84,791 |
| Inupiat | 0.4 /100 | #261 | Tragic $84,619 |
| Cree | 0.4 /100 | #262 | Tragic $84,574 |
| Belizeans | 0.4 /100 | #263 | Tragic $84,534 |
| Osage | 0.4 /100 | #264 | Tragic $84,461 |
| Sudanese | 0.4 /100 | #265 | Tragic $84,401 |
| Immigrants | Cabo Verde | 0.3 /100 | #266 | Tragic $84,304 |
| Hmong | 0.3 /100 | #267 | Tragic $84,258 |
| Sub-Saharan Africans | 0.3 /100 | #268 | Tragic $84,235 |
| Spanish American Indians | 0.3 /100 | #269 | Tragic $84,085 |
| Jamaicans | 0.3 /100 | #270 | Tragic $83,933 |
| Somalis | 0.2 /100 | #271 | Tragic $83,752 |
| Spanish Americans | 0.2 /100 | #272 | Tragic $83,722 |
| Iroquois | 0.2 /100 | #273 | Tragic $83,682 |