Immigrants from South Africa vs Immigrants from Congo Median Household Income
COMPARE
Immigrants from South Africa
Immigrants from Congo
Median Household Income
Median Household Income Comparison
Immigrants from South Africa
Immigrants from Congo
$95,800
MEDIAN HOUSEHOLD INCOME
99.9/ 100
METRIC RATING
52nd/ 347
METRIC RANK
$66,768
MEDIAN HOUSEHOLD INCOME
0.0/ 100
METRIC RATING
336th/ 347
METRIC RANK
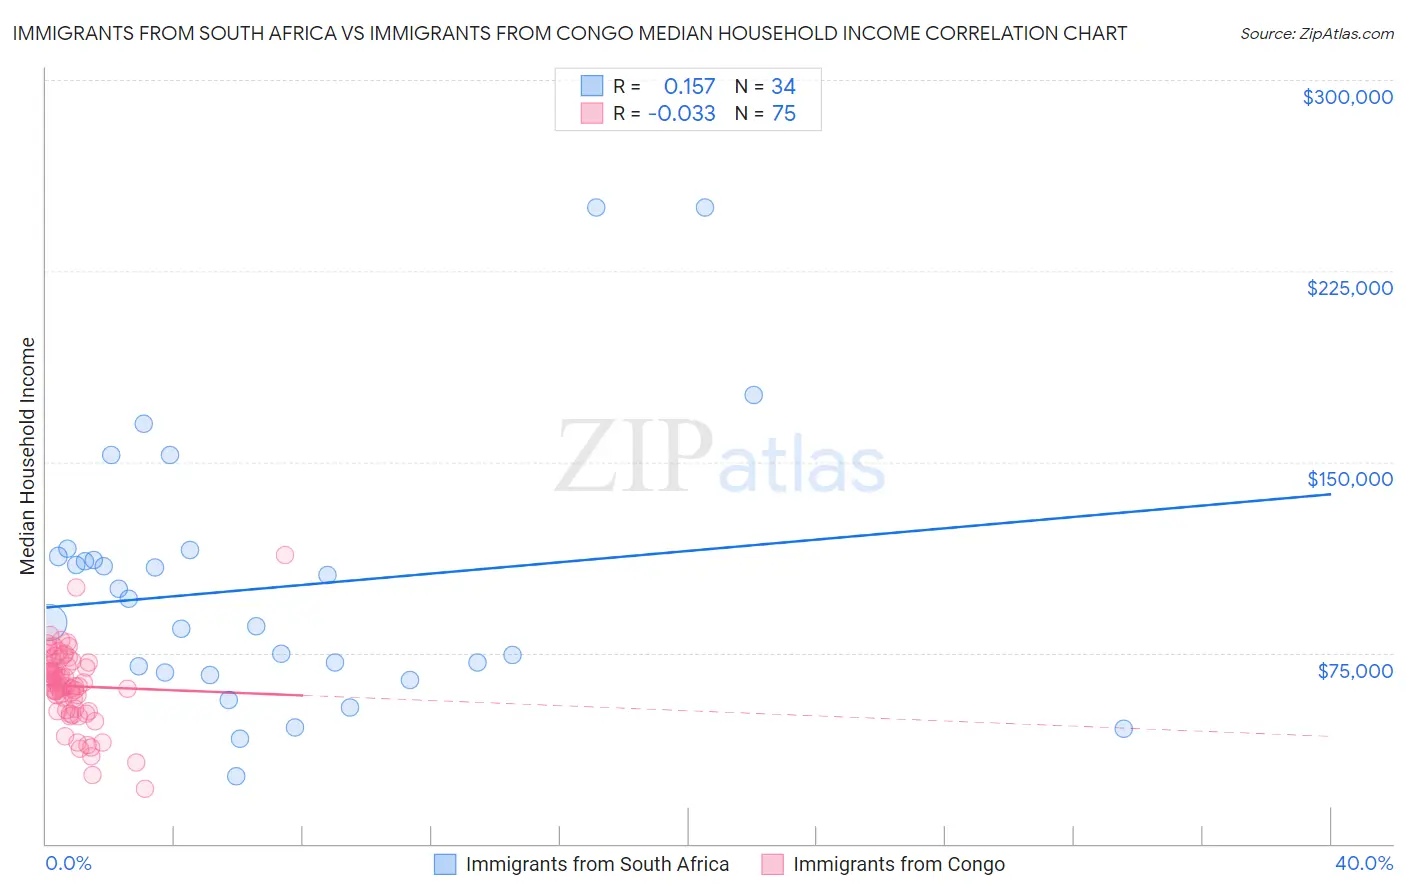
Immigrants from South Africa vs Immigrants from Congo Median Household Income Correlation Chart
The statistical analysis conducted on geographies consisting of 233,255,435 people shows a poor positive correlation between the proportion of Immigrants from South Africa and median household income in the United States with a correlation coefficient (R) of 0.157 and weighted average of $95,800. Similarly, the statistical analysis conducted on geographies consisting of 92,065,095 people shows no correlation between the proportion of Immigrants from Congo and median household income in the United States with a correlation coefficient (R) of -0.033 and weighted average of $66,768, a difference of 43.5%.
Median Household Income Correlation Summary
| Measurement | Immigrants from South Africa | Immigrants from Congo |
| Minimum | $26,321 | $21,567 |
| Maximum | $250,001 | $113,664 |
| Range | $223,680 | $92,097 |
| Mean | $100,741 | $61,890 |
| Median | $91,620 | $62,087 |
| Interquartile 25% (IQ1) | $67,153 | $52,383 |
| Interquartile 75% (IQ3) | $112,945 | $71,250 |
| Interquartile Range (IQR) | $45,792 | $18,867 |
| Standard Deviation (Sample) | $51,810 | $15,094 |
| Standard Deviation (Population) | $51,042 | $14,993 |
Similar Demographics by Median Household Income
Demographics Similar to Immigrants from South Africa by Median Household Income
In terms of median household income, the demographic groups most similar to Immigrants from South Africa are Paraguayan ($95,737, a difference of 0.070%), Egyptian ($95,673, a difference of 0.13%), Estonian ($95,930, a difference of 0.14%), Immigrants from Czechoslovakia ($95,319, a difference of 0.50%), and Immigrants from Malaysia ($96,292, a difference of 0.51%).
| Demographics | Rating | Rank | Median Household Income |
| Israelis | 99.9 /100 | #45 | Exceptional $96,552 |
| Australians | 99.9 /100 | #46 | Exceptional $96,490 |
| Immigrants | Russia | 99.9 /100 | #47 | Exceptional $96,378 |
| Cambodians | 99.9 /100 | #48 | Exceptional $96,324 |
| Immigrants | Malaysia | 99.9 /100 | #49 | Exceptional $96,292 |
| Bulgarians | 99.9 /100 | #50 | Exceptional $96,290 |
| Estonians | 99.9 /100 | #51 | Exceptional $95,930 |
| Immigrants | South Africa | 99.9 /100 | #52 | Exceptional $95,800 |
| Paraguayans | 99.9 /100 | #53 | Exceptional $95,737 |
| Egyptians | 99.9 /100 | #54 | Exceptional $95,673 |
| Immigrants | Czechoslovakia | 99.9 /100 | #55 | Exceptional $95,319 |
| Immigrants | Austria | 99.9 /100 | #56 | Exceptional $95,277 |
| New Zealanders | 99.8 /100 | #57 | Exceptional $95,146 |
| Soviet Union | 99.8 /100 | #58 | Exceptional $95,098 |
| Immigrants | Europe | 99.8 /100 | #59 | Exceptional $95,032 |
Demographics Similar to Immigrants from Congo by Median Household Income
In terms of median household income, the demographic groups most similar to Immigrants from Congo are Cheyenne ($66,974, a difference of 0.31%), Black/African American ($67,573, a difference of 1.2%), Kiowa ($65,914, a difference of 1.3%), Creek ($67,715, a difference of 1.4%), and Sioux ($67,792, a difference of 1.5%).
| Demographics | Rating | Rank | Median Household Income |
| Dutch West Indians | 0.0 /100 | #329 | Tragic $68,412 |
| Arapaho | 0.0 /100 | #330 | Tragic $67,965 |
| Natives/Alaskans | 0.0 /100 | #331 | Tragic $67,879 |
| Sioux | 0.0 /100 | #332 | Tragic $67,792 |
| Creek | 0.0 /100 | #333 | Tragic $67,715 |
| Blacks/African Americans | 0.0 /100 | #334 | Tragic $67,573 |
| Cheyenne | 0.0 /100 | #335 | Tragic $66,974 |
| Immigrants | Congo | 0.0 /100 | #336 | Tragic $66,768 |
| Kiowa | 0.0 /100 | #337 | Tragic $65,914 |
| Immigrants | Yemen | 0.0 /100 | #338 | Tragic $65,194 |
| Hopi | 0.0 /100 | #339 | Tragic $65,043 |
| Pueblo | 0.0 /100 | #340 | Tragic $64,692 |
| Crow | 0.0 /100 | #341 | Tragic $63,681 |
| Pima | 0.0 /100 | #342 | Tragic $63,262 |
| Houma | 0.0 /100 | #343 | Tragic $62,575 |