Romanian vs Icelander Seniors Poverty Over the Age of 65
COMPARE
Romanian
Icelander
Seniors Poverty Over the Age of 65
Seniors Poverty Over the Age of 65 Comparison
Romanians
Icelanders
10.1%
SENIORS POVERTY OVER THE AGE OF 65
97.2/ 100
METRIC RATING
86th/ 347
METRIC RANK
10.3%
SENIORS POVERTY OVER THE AGE OF 65
94.4/ 100
METRIC RATING
103rd/ 347
METRIC RANK
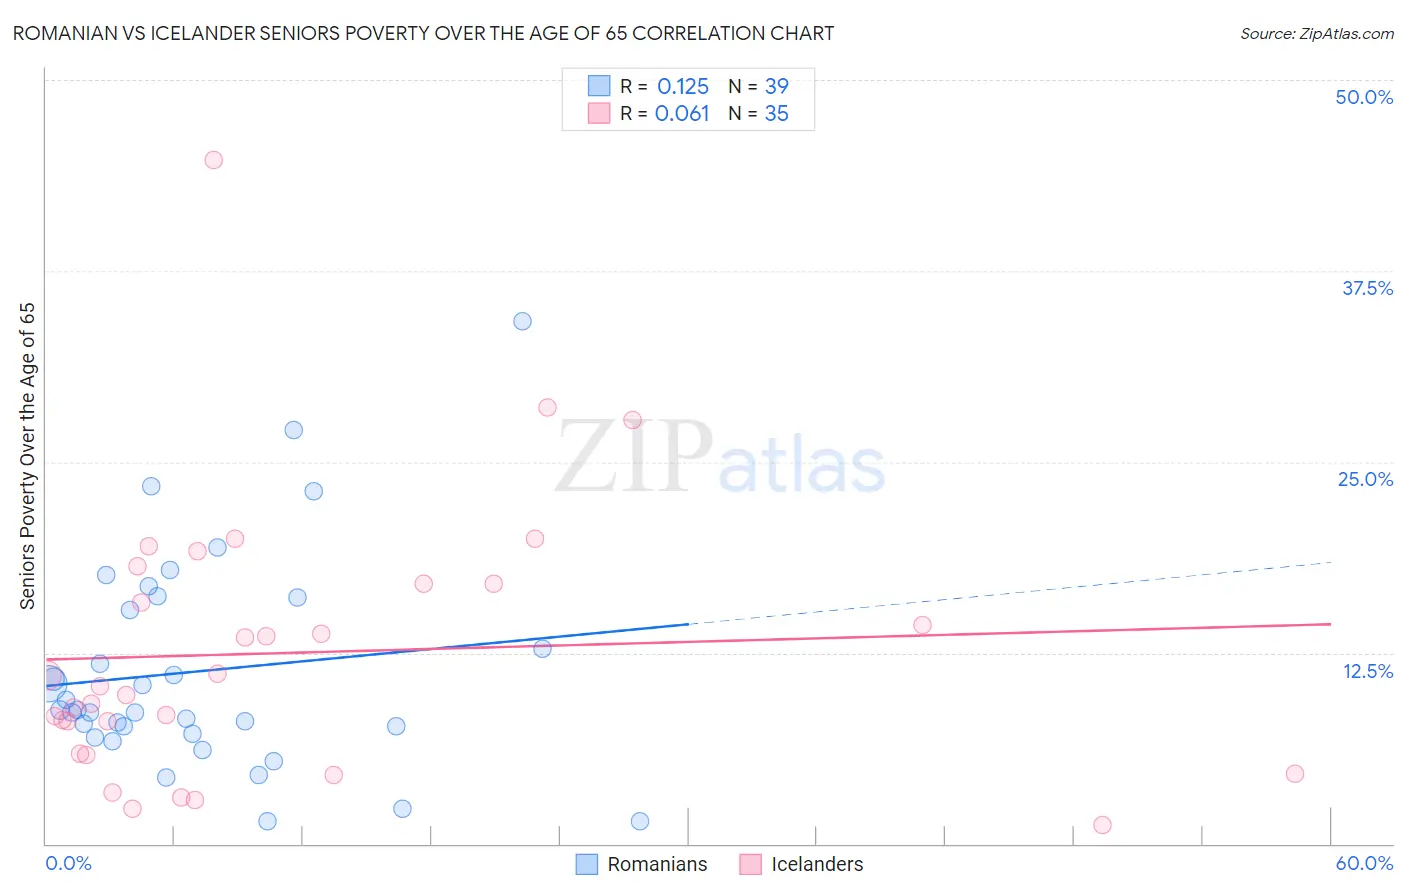
Romanian vs Icelander Seniors Poverty Over the Age of 65 Correlation Chart
The statistical analysis conducted on geographies consisting of 376,686,002 people shows a poor positive correlation between the proportion of Romanians and poverty level among seniors over the age of 65 in the United States with a correlation coefficient (R) of 0.125 and weighted average of 10.1%. Similarly, the statistical analysis conducted on geographies consisting of 159,526,770 people shows a slight positive correlation between the proportion of Icelanders and poverty level among seniors over the age of 65 in the United States with a correlation coefficient (R) of 0.061 and weighted average of 10.3%, a difference of 1.7%.
Seniors Poverty Over the Age of 65 Correlation Summary
| Measurement | Romanian | Icelander |
| Minimum | 1.4% | 1.2% |
| Maximum | 34.2% | 44.7% |
| Range | 32.7% | 43.5% |
| Mean | 11.3% | 12.5% |
| Median | 8.7% | 10.3% |
| Interquartile 25% (IQ1) | 7.2% | 5.9% |
| Interquartile 75% (IQ3) | 16.1% | 17.0% |
| Interquartile Range (IQR) | 8.9% | 11.1% |
| Standard Deviation (Sample) | 7.1% | 8.9% |
| Standard Deviation (Population) | 7.0% | 8.7% |
Demographics Similar to Romanians and Icelanders by Seniors Poverty Over the Age of 65
In terms of seniors poverty over the age of 65, the demographic groups most similar to Romanians are Immigrants from Afghanistan (10.1%, a difference of 0.020%), Immigrants from Nepal (10.1%, a difference of 0.020%), Burmese (10.1%, a difference of 0.020%), Jordanian (10.1%, a difference of 0.070%), and Immigrants from Bulgaria (10.1%, a difference of 0.15%). Similarly, the demographic groups most similar to Icelanders are South African (10.3%, a difference of 0.040%), Delaware (10.2%, a difference of 0.050%), Immigrants from Jordan (10.2%, a difference of 0.15%), Marshallese (10.2%, a difference of 0.47%), and Immigrants from Kuwait (10.2%, a difference of 0.54%).
| Demographics | Rating | Rank | Seniors Poverty Over the Age of 65 |
| Immigrants | Afghanistan | 97.2 /100 | #84 | Exceptional 10.1% |
| Immigrants | Nepal | 97.2 /100 | #85 | Exceptional 10.1% |
| Romanians | 97.2 /100 | #86 | Exceptional 10.1% |
| Burmese | 97.2 /100 | #87 | Exceptional 10.1% |
| Jordanians | 97.1 /100 | #88 | Exceptional 10.1% |
| Immigrants | Bulgaria | 97.0 /100 | #89 | Exceptional 10.1% |
| Ukrainians | 96.9 /100 | #90 | Exceptional 10.1% |
| Puget Sound Salish | 96.9 /100 | #91 | Exceptional 10.1% |
| Immigrants | Singapore | 96.9 /100 | #92 | Exceptional 10.1% |
| Immigrants | Sweden | 96.7 /100 | #93 | Exceptional 10.1% |
| Immigrants | Germany | 96.7 /100 | #94 | Exceptional 10.1% |
| Immigrants | Japan | 96.3 /100 | #95 | Exceptional 10.1% |
| Basques | 95.9 /100 | #96 | Exceptional 10.2% |
| Immigrants | Pakistan | 95.7 /100 | #97 | Exceptional 10.2% |
| Immigrants | Kuwait | 95.5 /100 | #98 | Exceptional 10.2% |
| Cypriots | 95.5 /100 | #99 | Exceptional 10.2% |
| Marshallese | 95.3 /100 | #100 | Exceptional 10.2% |
| Immigrants | Jordan | 94.7 /100 | #101 | Exceptional 10.2% |
| Delaware | 94.5 /100 | #102 | Exceptional 10.2% |
| Icelanders | 94.4 /100 | #103 | Exceptional 10.3% |
| South Africans | 94.3 /100 | #104 | Exceptional 10.3% |