Hungarian vs Scotch-Irish Median Male Earnings
COMPARE
Hungarian
Scotch-Irish
Median Male Earnings
Median Male Earnings Comparison
Hungarians
Scotch-Irish
$57,309
MEDIAN MALE EARNINGS
94.0/ 100
METRIC RATING
118th/ 347
METRIC RANK
$53,658
MEDIAN MALE EARNINGS
30.6/ 100
METRIC RATING
192nd/ 347
METRIC RANK
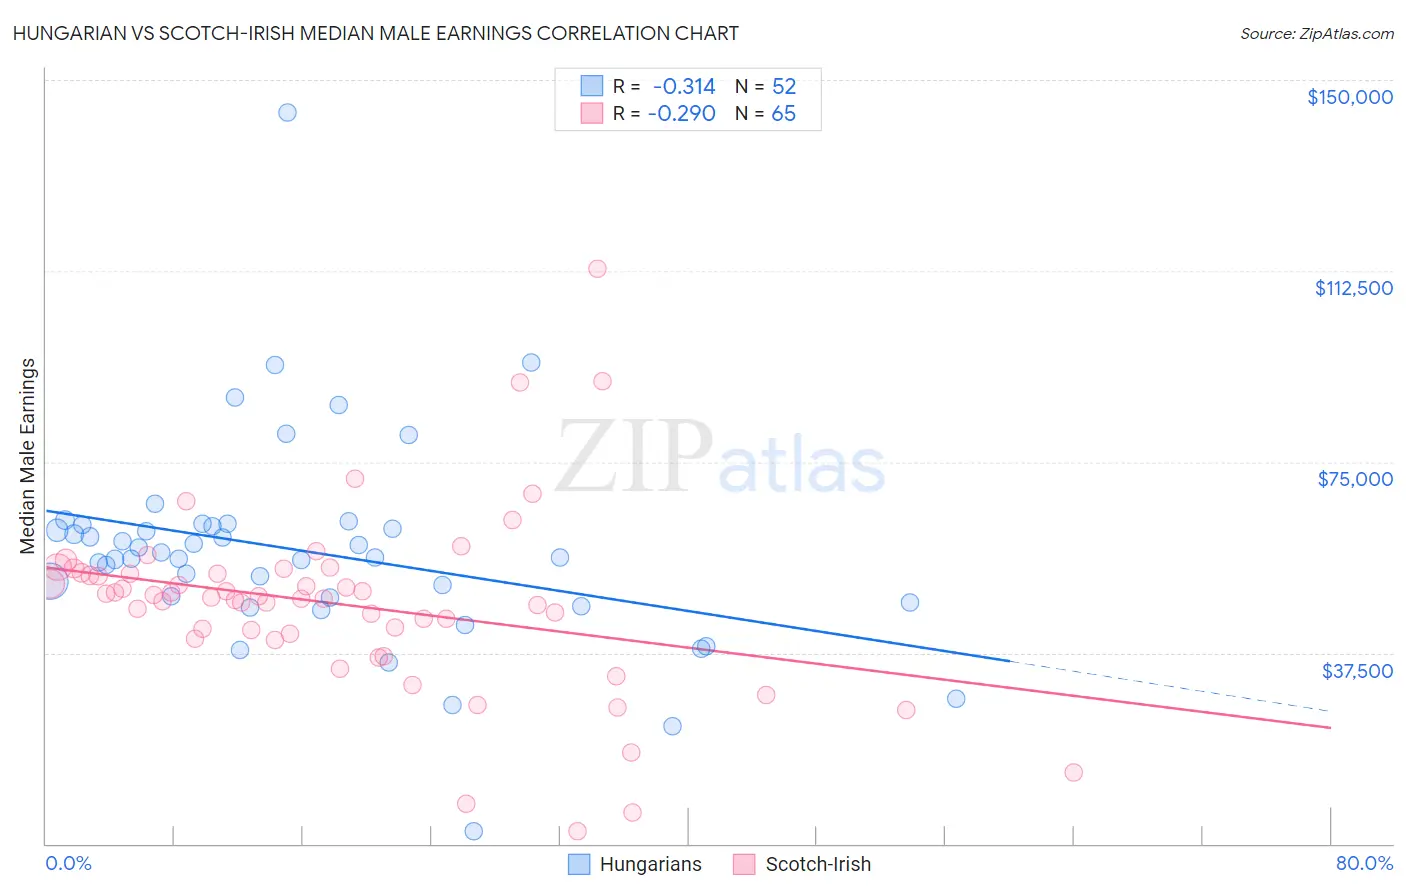
Hungarian vs Scotch-Irish Median Male Earnings Correlation Chart
The statistical analysis conducted on geographies consisting of 485,879,965 people shows a mild negative correlation between the proportion of Hungarians and median male earnings in the United States with a correlation coefficient (R) of -0.314 and weighted average of $57,309. Similarly, the statistical analysis conducted on geographies consisting of 547,724,250 people shows a weak negative correlation between the proportion of Scotch-Irish and median male earnings in the United States with a correlation coefficient (R) of -0.290 and weighted average of $53,658, a difference of 6.8%.
Median Male Earnings Correlation Summary
| Measurement | Hungarian | Scotch-Irish |
| Minimum | $2,499 | $2,499 |
| Maximum | $143,630 | $113,000 |
| Range | $141,131 | $110,501 |
| Mean | $57,349 | $47,040 |
| Median | $56,238 | $48,432 |
| Interquartile 25% (IQ1) | $47,969 | $40,813 |
| Interquartile 75% (IQ3) | $62,536 | $53,223 |
| Interquartile Range (IQR) | $14,567 | $12,411 |
| Standard Deviation (Sample) | $20,677 | $17,914 |
| Standard Deviation (Population) | $20,477 | $17,776 |
Similar Demographics by Median Male Earnings
Demographics Similar to Hungarians by Median Male Earnings
In terms of median male earnings, the demographic groups most similar to Hungarians are Arab ($57,298, a difference of 0.020%), Canadian ($57,286, a difference of 0.040%), Immigrants from Zimbabwe ($57,352, a difference of 0.080%), Lebanese ($57,409, a difference of 0.18%), and Immigrants from Albania ($57,179, a difference of 0.23%).
| Demographics | Rating | Rank | Median Male Earnings |
| Europeans | 95.6 /100 | #111 | Exceptional $57,637 |
| Immigrants | Afghanistan | 95.4 /100 | #112 | Exceptional $57,582 |
| Carpatho Rusyns | 95.3 /100 | #113 | Exceptional $57,572 |
| Immigrants | Kuwait | 95.3 /100 | #114 | Exceptional $57,562 |
| Swedes | 94.8 /100 | #115 | Exceptional $57,445 |
| Lebanese | 94.6 /100 | #116 | Exceptional $57,409 |
| Immigrants | Zimbabwe | 94.3 /100 | #117 | Exceptional $57,352 |
| Hungarians | 94.0 /100 | #118 | Exceptional $57,309 |
| Arabs | 94.0 /100 | #119 | Exceptional $57,298 |
| Canadians | 93.9 /100 | #120 | Exceptional $57,286 |
| Immigrants | Albania | 93.3 /100 | #121 | Exceptional $57,179 |
| Immigrants | Jordan | 93.1 /100 | #122 | Exceptional $57,145 |
| Slovenes | 93.1 /100 | #123 | Exceptional $57,145 |
| Chileans | 91.9 /100 | #124 | Exceptional $56,973 |
| Immigrants | Morocco | 91.8 /100 | #125 | Exceptional $56,958 |
Demographics Similar to Scotch-Irish by Median Male Earnings
In terms of median male earnings, the demographic groups most similar to Scotch-Irish are Guamanian/Chamorro ($53,661, a difference of 0.010%), Kenyan ($53,647, a difference of 0.020%), Uruguayan ($53,680, a difference of 0.040%), Puget Sound Salish ($53,704, a difference of 0.090%), and Immigrants from Eastern Africa ($53,713, a difference of 0.10%).
| Demographics | Rating | Rank | Median Male Earnings |
| Immigrants | Sierra Leone | 36.0 /100 | #185 | Fair $53,905 |
| Colombians | 34.4 /100 | #186 | Fair $53,832 |
| Immigrants | Eritrea | 31.8 /100 | #187 | Fair $53,715 |
| Immigrants | Eastern Africa | 31.8 /100 | #188 | Fair $53,713 |
| Puget Sound Salish | 31.6 /100 | #189 | Fair $53,704 |
| Uruguayans | 31.1 /100 | #190 | Fair $53,680 |
| Guamanians/Chamorros | 30.7 /100 | #191 | Fair $53,661 |
| Scotch-Irish | 30.6 /100 | #192 | Fair $53,658 |
| Kenyans | 30.4 /100 | #193 | Fair $53,647 |
| Spanish | 29.0 /100 | #194 | Fair $53,576 |
| Immigrants | Azores | 27.5 /100 | #195 | Fair $53,503 |
| Immigrants | Africa | 26.6 /100 | #196 | Fair $53,457 |
| Immigrants | Kenya | 26.0 /100 | #197 | Fair $53,427 |
| Immigrants | Costa Rica | 22.6 /100 | #198 | Fair $53,237 |
| Tongans | 22.3 /100 | #199 | Fair $53,218 |