Puerto Rican vs Immigrants from Cuba Unemployment Among Ages 30 to 34 years
COMPARE
Puerto Rican
Immigrants from Cuba
Unemployment Among Ages 30 to 34 years
Unemployment Among Ages 30 to 34 years Comparison
Puerto Ricans
Immigrants from Cuba
8.9%
UNEMPLOYMENT AMONG AGES 30 TO 34 YEARS
0.0/ 100
METRIC RATING
335th/ 347
METRIC RANK
5.0%
UNEMPLOYMENT AMONG AGES 30 TO 34 YEARS
99.4/ 100
METRIC RATING
28th/ 347
METRIC RANK
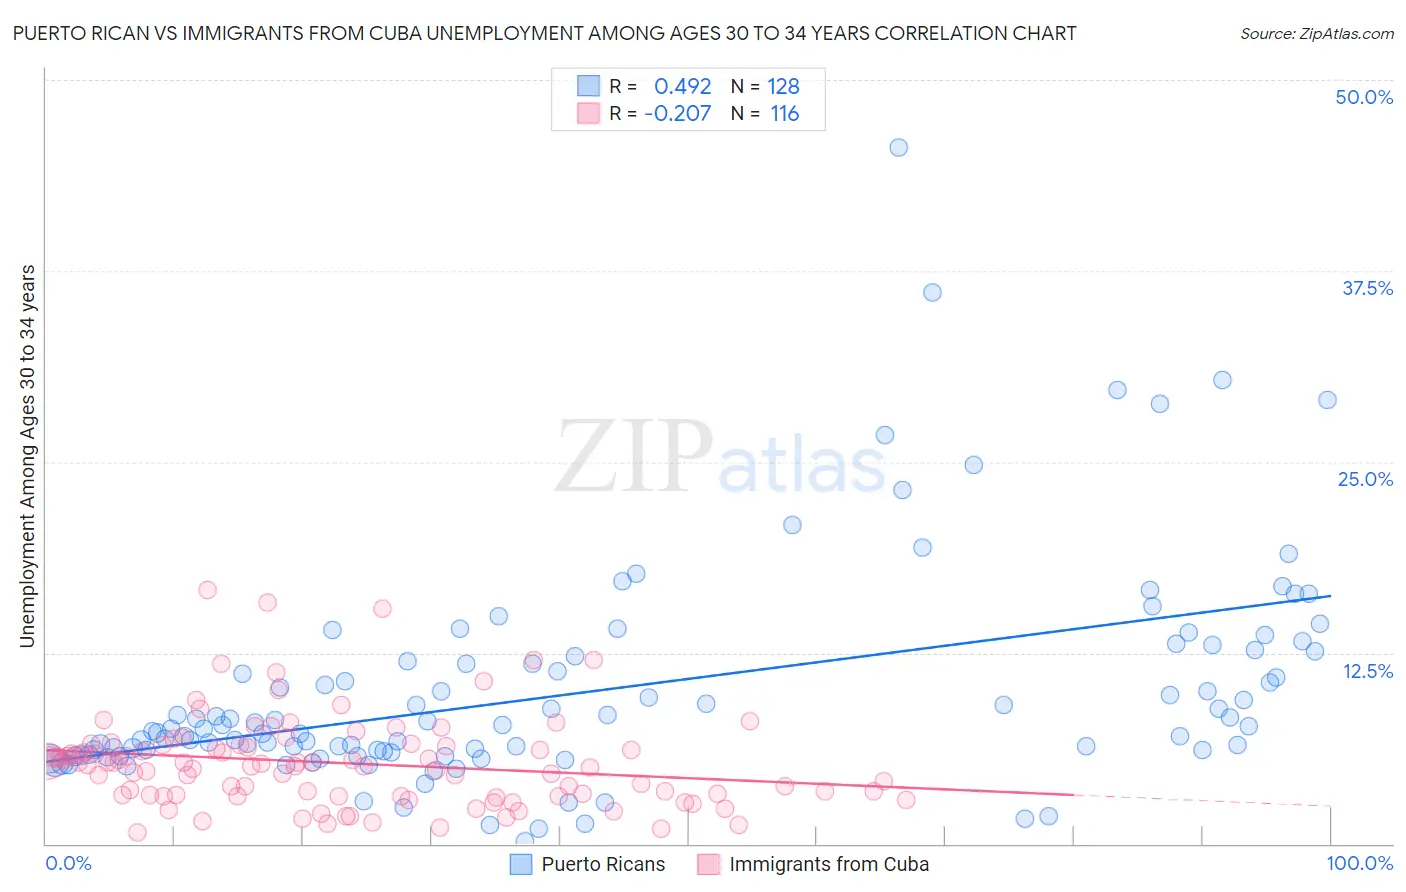
Puerto Rican vs Immigrants from Cuba Unemployment Among Ages 30 to 34 years Correlation Chart
The statistical analysis conducted on geographies consisting of 479,130,196 people shows a moderate positive correlation between the proportion of Puerto Ricans and unemployment rate among population between the ages 30 and 34 in the United States with a correlation coefficient (R) of 0.492 and weighted average of 8.9%. Similarly, the statistical analysis conducted on geographies consisting of 311,360,342 people shows a weak negative correlation between the proportion of Immigrants from Cuba and unemployment rate among population between the ages 30 and 34 in the United States with a correlation coefficient (R) of -0.207 and weighted average of 5.0%, a difference of 78.3%.
Unemployment Among Ages 30 to 34 years Correlation Summary
| Measurement | Puerto Rican | Immigrants from Cuba |
| Minimum | 0.20% | 0.70% |
| Maximum | 45.6% | 16.6% |
| Range | 45.4% | 15.9% |
| Mean | 10.0% | 5.3% |
| Median | 7.6% | 5.1% |
| Interquartile 25% (IQ1) | 6.0% | 3.1% |
| Interquartile 75% (IQ3) | 12.1% | 6.5% |
| Interquartile Range (IQR) | 6.1% | 3.3% |
| Standard Deviation (Sample) | 7.2% | 3.0% |
| Standard Deviation (Population) | 7.1% | 3.0% |
Similar Demographics by Unemployment Among Ages 30 to 34 years
Demographics Similar to Puerto Ricans by Unemployment Among Ages 30 to 34 years
In terms of unemployment among ages 30 to 34 years, the demographic groups most similar to Puerto Ricans are Colville (9.0%, a difference of 1.9%), Alaska Native (8.5%, a difference of 4.5%), Pueblo (8.3%, a difference of 7.3%), Native/Alaskan (8.2%, a difference of 7.8%), and Pima (9.6%, a difference of 8.7%).
| Demographics | Rating | Rank | Unemployment Among Ages 30 to 34 years |
| Chippewa | 0.0 /100 | #328 | Tragic 7.8% |
| Cheyenne | 0.0 /100 | #329 | Tragic 7.8% |
| Shoshone | 0.0 /100 | #330 | Tragic 7.9% |
| Sioux | 0.0 /100 | #331 | Tragic 8.0% |
| Natives/Alaskans | 0.0 /100 | #332 | Tragic 8.2% |
| Pueblo | 0.0 /100 | #333 | Tragic 8.3% |
| Alaska Natives | 0.0 /100 | #334 | Tragic 8.5% |
| Puerto Ricans | 0.0 /100 | #335 | Tragic 8.9% |
| Colville | 0.0 /100 | #336 | Tragic 9.0% |
| Pima | 0.0 /100 | #337 | Tragic 9.6% |
| Yakama | 0.0 /100 | #338 | Tragic 9.8% |
| Tohono O'odham | 0.0 /100 | #339 | Tragic 9.8% |
| Crow | 0.0 /100 | #340 | Tragic 10.3% |
| Navajo | 0.0 /100 | #341 | Tragic 10.6% |
| Yuman | 0.0 /100 | #342 | Tragic 10.6% |
Demographics Similar to Immigrants from Cuba by Unemployment Among Ages 30 to 34 years
In terms of unemployment among ages 30 to 34 years, the demographic groups most similar to Immigrants from Cuba are German Russian (5.0%, a difference of 0.020%), Norwegian (5.0%, a difference of 0.040%), Somali (5.0%, a difference of 0.13%), Immigrants from Zaire (5.0%, a difference of 0.18%), and Danish (5.0%, a difference of 0.24%).
| Demographics | Rating | Rank | Unemployment Among Ages 30 to 34 years |
| Ethiopians | 99.8 /100 | #21 | Exceptional 4.9% |
| Immigrants | South Central Asia | 99.8 /100 | #22 | Exceptional 4.9% |
| Hmong | 99.8 /100 | #23 | Exceptional 4.9% |
| Ugandans | 99.7 /100 | #24 | Exceptional 4.9% |
| Immigrants | Singapore | 99.5 /100 | #25 | Exceptional 5.0% |
| Immigrants | Kuwait | 99.5 /100 | #26 | Exceptional 5.0% |
| Danes | 99.5 /100 | #27 | Exceptional 5.0% |
| Immigrants | Cuba | 99.4 /100 | #28 | Exceptional 5.0% |
| German Russians | 99.4 /100 | #29 | Exceptional 5.0% |
| Norwegians | 99.4 /100 | #30 | Exceptional 5.0% |
| Somalis | 99.3 /100 | #31 | Exceptional 5.0% |
| Immigrants | Zaire | 99.3 /100 | #32 | Exceptional 5.0% |
| Immigrants | Saudi Arabia | 99.3 /100 | #33 | Exceptional 5.0% |
| Latvians | 99.3 /100 | #34 | Exceptional 5.0% |
| Immigrants | Ethiopia | 99.2 /100 | #35 | Exceptional 5.0% |