Pueblo vs Immigrants from Senegal Median Female Earnings
COMPARE
Pueblo
Immigrants from Senegal
Median Female Earnings
Median Female Earnings Comparison
Pueblo
Immigrants from Senegal
$32,564
MEDIAN FEMALE EARNINGS
0.0/ 100
METRIC RATING
343rd/ 347
METRIC RANK
$40,157
MEDIAN FEMALE EARNINGS
72.2/ 100
METRIC RATING
158th/ 347
METRIC RANK
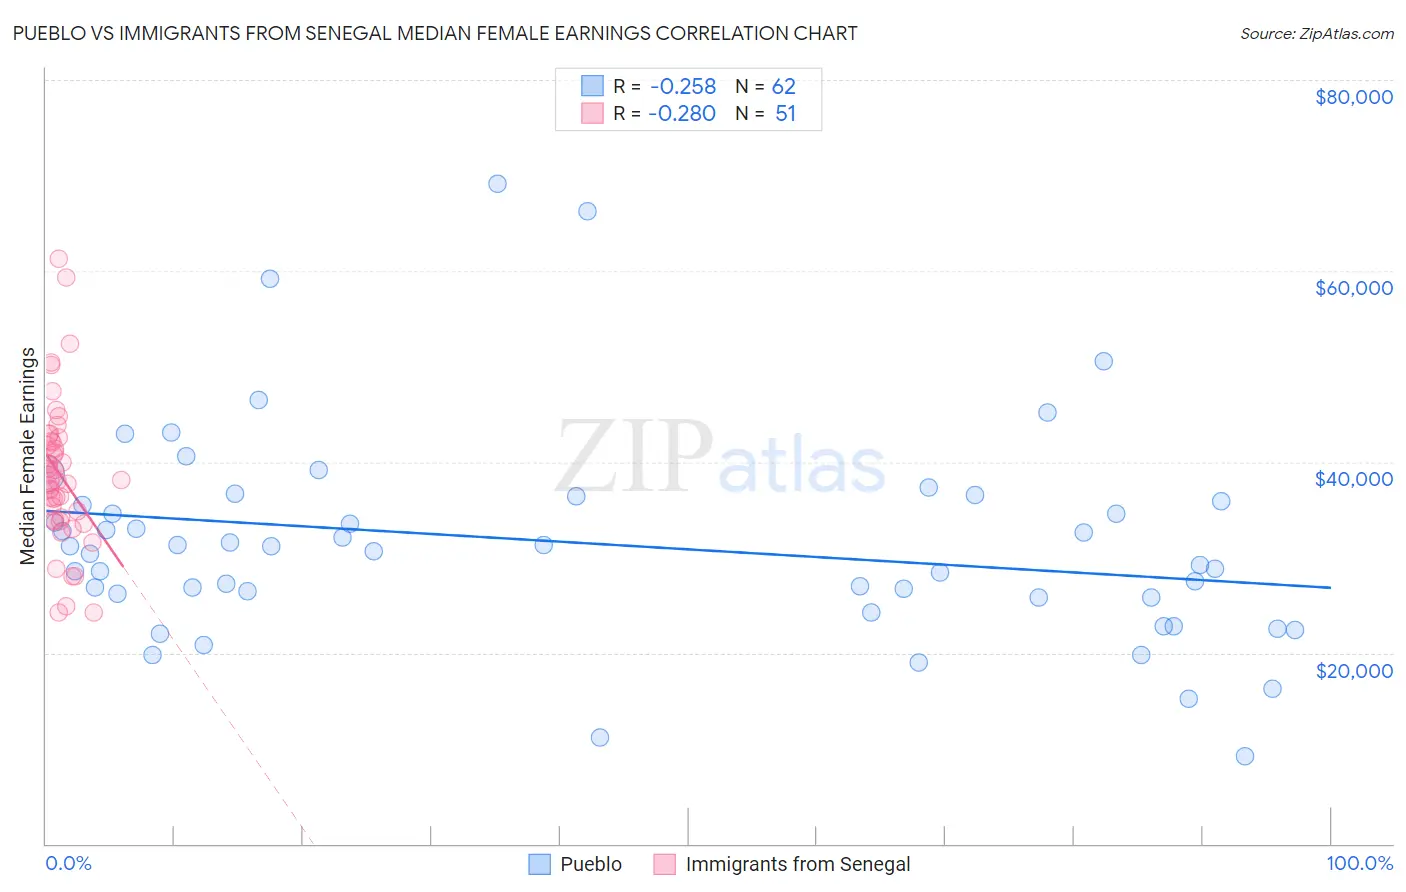
Pueblo vs Immigrants from Senegal Median Female Earnings Correlation Chart
The statistical analysis conducted on geographies consisting of 120,036,612 people shows a weak negative correlation between the proportion of Pueblo and median female earnings in the United States with a correlation coefficient (R) of -0.258 and weighted average of $32,564. Similarly, the statistical analysis conducted on geographies consisting of 90,128,045 people shows a weak negative correlation between the proportion of Immigrants from Senegal and median female earnings in the United States with a correlation coefficient (R) of -0.280 and weighted average of $40,157, a difference of 23.3%.
Median Female Earnings Correlation Summary
| Measurement | Pueblo | Immigrants from Senegal |
| Minimum | $9,219 | $24,201 |
| Maximum | $69,074 | $61,281 |
| Range | $59,855 | $37,080 |
| Mean | $31,512 | $38,684 |
| Median | $30,863 | $38,134 |
| Interquartile 25% (IQ1) | $25,792 | $33,970 |
| Interquartile 75% (IQ3) | $35,833 | $42,197 |
| Interquartile Range (IQR) | $10,041 | $8,227 |
| Standard Deviation (Sample) | $11,084 | $7,634 |
| Standard Deviation (Population) | $10,994 | $7,559 |
Similar Demographics by Median Female Earnings
Demographics Similar to Pueblo by Median Female Earnings
In terms of median female earnings, the demographic groups most similar to Pueblo are Lumbee ($32,500, a difference of 0.20%), Yup'ik ($32,730, a difference of 0.51%), Navajo ($33,046, a difference of 1.5%), Tohono O'odham ($33,205, a difference of 2.0%), and Immigrants from Mexico ($33,236, a difference of 2.1%).
| Demographics | Rating | Rank | Median Female Earnings |
| Mexicans | 0.0 /100 | #333 | Tragic $33,664 |
| Spanish American Indians | 0.0 /100 | #334 | Tragic $33,625 |
| Creek | 0.0 /100 | #335 | Tragic $33,437 |
| Ottawa | 0.0 /100 | #336 | Tragic $33,378 |
| Yakama | 0.0 /100 | #337 | Tragic $33,354 |
| Immigrants | Cuba | 0.0 /100 | #338 | Tragic $33,291 |
| Immigrants | Mexico | 0.0 /100 | #339 | Tragic $33,236 |
| Tohono O'odham | 0.0 /100 | #340 | Tragic $33,205 |
| Navajo | 0.0 /100 | #341 | Tragic $33,046 |
| Yup'ik | 0.0 /100 | #342 | Tragic $32,730 |
| Pueblo | 0.0 /100 | #343 | Tragic $32,564 |
| Lumbee | 0.0 /100 | #344 | Tragic $32,500 |
| Puerto Ricans | 0.0 /100 | #345 | Tragic $31,560 |
| Arapaho | 0.0 /100 | #346 | Tragic $31,489 |
| Houma | 0.0 /100 | #347 | Tragic $30,343 |
Demographics Similar to Immigrants from Senegal by Median Female Earnings
In terms of median female earnings, the demographic groups most similar to Immigrants from Senegal are Immigrants from Vietnam ($40,153, a difference of 0.010%), Portuguese ($40,177, a difference of 0.050%), Peruvian ($40,234, a difference of 0.19%), Inupiat ($40,080, a difference of 0.19%), and Alsatian ($40,060, a difference of 0.24%).
| Demographics | Rating | Rank | Median Female Earnings |
| Immigrants | Armenia | 79.2 /100 | #151 | Good $40,340 |
| West Indians | 78.4 /100 | #152 | Good $40,317 |
| British West Indians | 77.7 /100 | #153 | Good $40,299 |
| Immigrants | Oceania | 77.6 /100 | #154 | Good $40,297 |
| Immigrants | Africa | 76.2 /100 | #155 | Good $40,257 |
| Peruvians | 75.3 /100 | #156 | Good $40,234 |
| Portuguese | 73.0 /100 | #157 | Good $40,177 |
| Immigrants | Senegal | 72.2 /100 | #158 | Good $40,157 |
| Immigrants | Vietnam | 72.0 /100 | #159 | Good $40,153 |
| Inupiat | 68.9 /100 | #160 | Good $40,080 |
| Alsatians | 68.0 /100 | #161 | Good $40,060 |
| South American Indians | 66.1 /100 | #162 | Good $40,019 |
| Lebanese | 65.5 /100 | #163 | Good $40,006 |
| Immigrants | Saudi Arabia | 62.9 /100 | #164 | Good $39,952 |
| Immigrants | Bangladesh | 60.8 /100 | #165 | Good $39,910 |