Uruguayan vs Slovak Median Male Earnings
COMPARE
Uruguayan
Slovak
Median Male Earnings
Median Male Earnings Comparison
Uruguayans
Slovaks
$53,680
MEDIAN MALE EARNINGS
31.1/ 100
METRIC RATING
190th/ 347
METRIC RANK
$56,306
MEDIAN MALE EARNINGS
85.5/ 100
METRIC RATING
138th/ 347
METRIC RANK
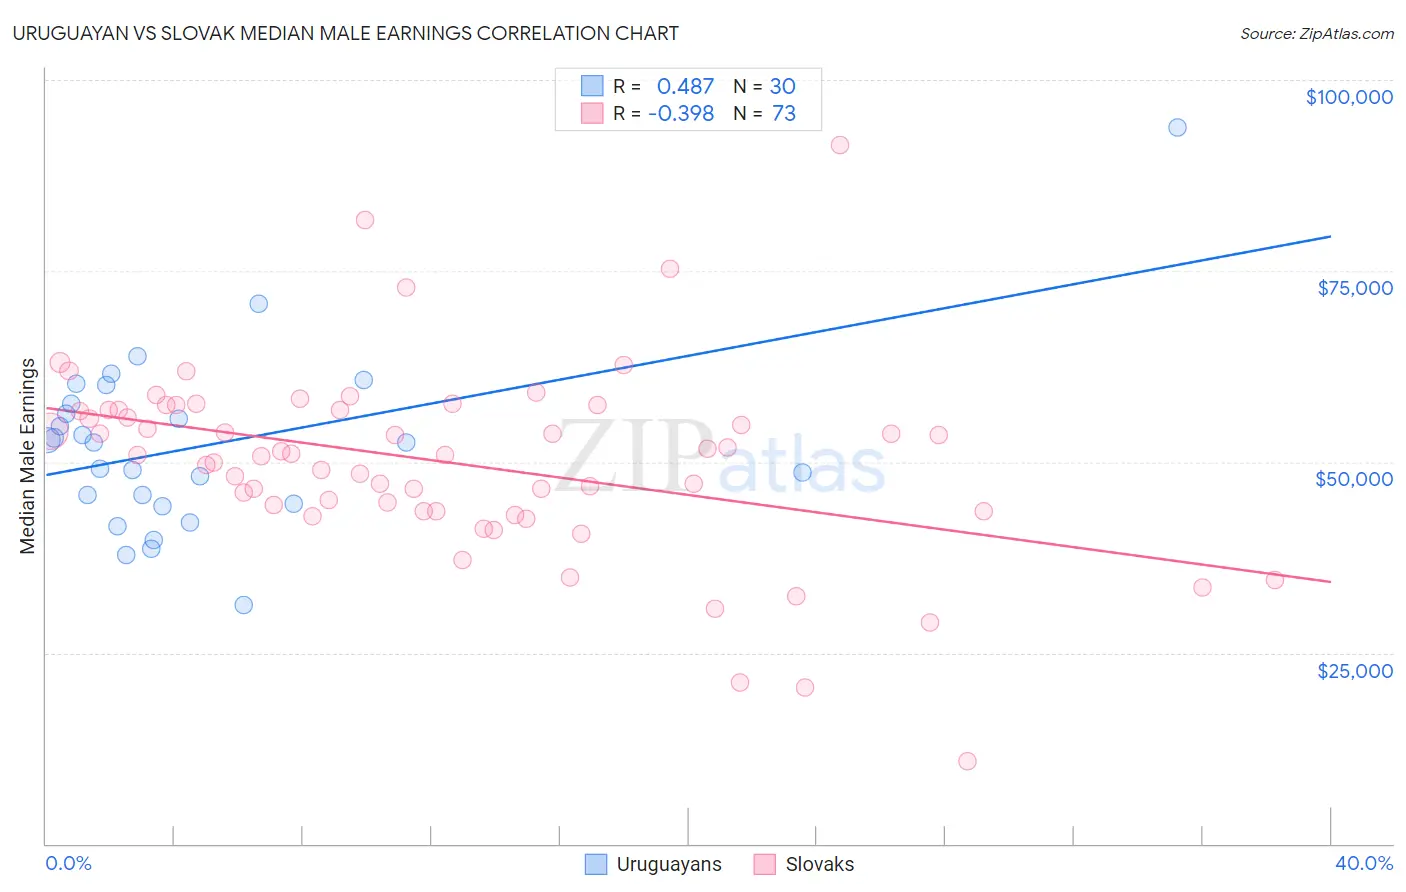
Uruguayan vs Slovak Median Male Earnings Correlation Chart
The statistical analysis conducted on geographies consisting of 144,776,277 people shows a moderate positive correlation between the proportion of Uruguayans and median male earnings in the United States with a correlation coefficient (R) of 0.487 and weighted average of $53,680. Similarly, the statistical analysis conducted on geographies consisting of 397,698,254 people shows a mild negative correlation between the proportion of Slovaks and median male earnings in the United States with a correlation coefficient (R) of -0.398 and weighted average of $56,306, a difference of 4.9%.
Median Male Earnings Correlation Summary
| Measurement | Uruguayan | Slovak |
| Minimum | $31,250 | $10,727 |
| Maximum | $93,710 | $91,563 |
| Range | $62,460 | $80,836 |
| Mean | $52,178 | $49,965 |
| Median | $52,491 | $50,933 |
| Interquartile 25% (IQ1) | $44,514 | $43,560 |
| Interquartile 75% (IQ3) | $57,550 | $56,815 |
| Interquartile Range (IQR) | $13,036 | $13,254 |
| Standard Deviation (Sample) | $11,765 | $12,608 |
| Standard Deviation (Population) | $11,568 | $12,522 |
Similar Demographics by Median Male Earnings
Demographics Similar to Uruguayans by Median Male Earnings
In terms of median male earnings, the demographic groups most similar to Uruguayans are Puget Sound Salish ($53,704, a difference of 0.040%), Guamanian/Chamorro ($53,661, a difference of 0.040%), Scotch-Irish ($53,658, a difference of 0.040%), Immigrants from Eritrea ($53,715, a difference of 0.060%), and Immigrants from Eastern Africa ($53,713, a difference of 0.060%).
| Demographics | Rating | Rank | Median Male Earnings |
| Immigrants | South America | 37.3 /100 | #183 | Fair $53,962 |
| Whites/Caucasians | 36.5 /100 | #184 | Fair $53,925 |
| Immigrants | Sierra Leone | 36.0 /100 | #185 | Fair $53,905 |
| Colombians | 34.4 /100 | #186 | Fair $53,832 |
| Immigrants | Eritrea | 31.8 /100 | #187 | Fair $53,715 |
| Immigrants | Eastern Africa | 31.8 /100 | #188 | Fair $53,713 |
| Puget Sound Salish | 31.6 /100 | #189 | Fair $53,704 |
| Uruguayans | 31.1 /100 | #190 | Fair $53,680 |
| Guamanians/Chamorros | 30.7 /100 | #191 | Fair $53,661 |
| Scotch-Irish | 30.6 /100 | #192 | Fair $53,658 |
| Kenyans | 30.4 /100 | #193 | Fair $53,647 |
| Spanish | 29.0 /100 | #194 | Fair $53,576 |
| Immigrants | Azores | 27.5 /100 | #195 | Fair $53,503 |
| Immigrants | Africa | 26.6 /100 | #196 | Fair $53,457 |
| Immigrants | Kenya | 26.0 /100 | #197 | Fair $53,427 |
Demographics Similar to Slovaks by Median Male Earnings
In terms of median male earnings, the demographic groups most similar to Slovaks are Zimbabwean ($56,302, a difference of 0.010%), Luxembourger ($56,300, a difference of 0.010%), Danish ($56,246, a difference of 0.11%), Ethiopian ($56,243, a difference of 0.11%), and Slavic ($56,390, a difference of 0.15%).
| Demographics | Rating | Rank | Median Male Earnings |
| Portuguese | 89.4 /100 | #131 | Excellent $56,663 |
| Czechs | 88.2 /100 | #132 | Excellent $56,546 |
| Immigrants | Germany | 88.2 /100 | #133 | Excellent $56,542 |
| Moroccans | 87.7 /100 | #134 | Excellent $56,499 |
| Irish | 87.4 /100 | #135 | Excellent $56,464 |
| Immigrants | Saudi Arabia | 87.2 /100 | #136 | Excellent $56,452 |
| Slavs | 86.5 /100 | #137 | Excellent $56,390 |
| Slovaks | 85.5 /100 | #138 | Excellent $56,306 |
| Zimbabweans | 85.5 /100 | #139 | Excellent $56,302 |
| Luxembourgers | 85.5 /100 | #140 | Excellent $56,300 |
| Danes | 84.8 /100 | #141 | Excellent $56,246 |
| Ethiopians | 84.8 /100 | #142 | Excellent $56,243 |
| Sri Lankans | 83.4 /100 | #143 | Excellent $56,136 |
| Immigrants | Uganda | 82.4 /100 | #144 | Excellent $56,064 |
| Norwegians | 80.9 /100 | #145 | Excellent $55,965 |