Potawatomi vs Mexican American Indian Median Family Income
COMPARE
Potawatomi
Mexican American Indian
Median Family Income
Median Family Income Comparison
Potawatomi
Mexican American Indians
$88,265
MEDIAN FAMILY INCOME
0.1/ 100
METRIC RATING
287th/ 347
METRIC RANK
$90,918
MEDIAN FAMILY INCOME
0.2/ 100
METRIC RATING
267th/ 347
METRIC RANK
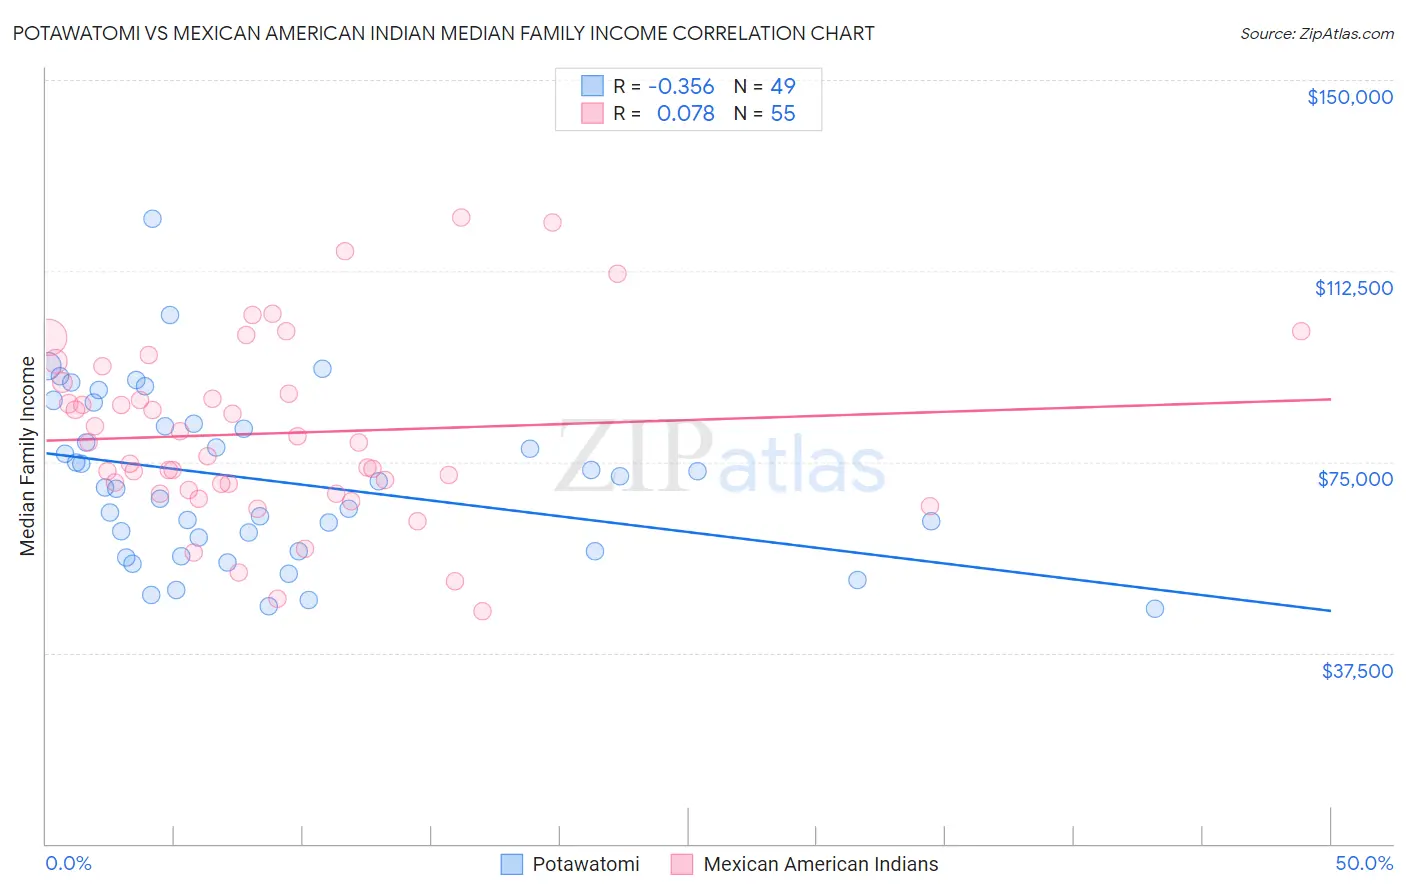
Potawatomi vs Mexican American Indian Median Family Income Correlation Chart
The statistical analysis conducted on geographies consisting of 117,752,376 people shows a mild negative correlation between the proportion of Potawatomi and median family income in the United States with a correlation coefficient (R) of -0.356 and weighted average of $88,265. Similarly, the statistical analysis conducted on geographies consisting of 317,461,685 people shows a slight positive correlation between the proportion of Mexican American Indians and median family income in the United States with a correlation coefficient (R) of 0.078 and weighted average of $90,918, a difference of 3.0%.
Median Family Income Correlation Summary
| Measurement | Potawatomi | Mexican American Indian |
| Minimum | $46,250 | $45,568 |
| Maximum | $122,813 | $122,917 |
| Range | $76,563 | $77,349 |
| Mean | $71,315 | $80,601 |
| Median | $70,018 | $78,819 |
| Interquartile 25% (IQ1) | $57,500 | $69,567 |
| Interquartile 75% (IQ3) | $82,232 | $90,530 |
| Interquartile Range (IQR) | $24,732 | $20,964 |
| Standard Deviation (Sample) | $16,474 | $17,524 |
| Standard Deviation (Population) | $16,305 | $17,364 |
Demographics Similar to Potawatomi and Mexican American Indians by Median Family Income
In terms of median family income, the demographic groups most similar to Potawatomi are Immigrants from Nicaragua ($88,267, a difference of 0.0%), Guatemalan ($88,295, a difference of 0.030%), Indonesian ($88,301, a difference of 0.040%), Bangladeshi ($88,358, a difference of 0.11%), and Comanche ($88,556, a difference of 0.33%). Similarly, the demographic groups most similar to Mexican American Indians are Cree ($90,882, a difference of 0.040%), Belizean ($90,880, a difference of 0.040%), Jamaican ($90,581, a difference of 0.37%), Iroquois ($90,543, a difference of 0.41%), and Immigrants from Liberia ($90,450, a difference of 0.52%).
| Demographics | Rating | Rank | Median Family Income |
| Mexican American Indians | 0.2 /100 | #267 | Tragic $90,918 |
| Cree | 0.2 /100 | #268 | Tragic $90,882 |
| Belizeans | 0.2 /100 | #269 | Tragic $90,880 |
| Jamaicans | 0.2 /100 | #270 | Tragic $90,581 |
| Iroquois | 0.2 /100 | #271 | Tragic $90,543 |
| Immigrants | Liberia | 0.2 /100 | #272 | Tragic $90,450 |
| Immigrants | Micronesia | 0.2 /100 | #273 | Tragic $90,345 |
| Spanish Americans | 0.2 /100 | #274 | Tragic $90,322 |
| Immigrants | St. Vincent and the Grenadines | 0.2 /100 | #275 | Tragic $90,094 |
| Immigrants | Zaire | 0.1 /100 | #276 | Tragic $89,285 |
| Immigrants | Jamaica | 0.1 /100 | #277 | Tragic $89,268 |
| Immigrants | Grenada | 0.1 /100 | #278 | Tragic $89,249 |
| Immigrants | Belize | 0.1 /100 | #279 | Tragic $89,197 |
| British West Indians | 0.1 /100 | #280 | Tragic $88,987 |
| Blackfeet | 0.1 /100 | #281 | Tragic $88,717 |
| Comanche | 0.1 /100 | #282 | Tragic $88,556 |
| Bangladeshis | 0.1 /100 | #283 | Tragic $88,358 |
| Indonesians | 0.1 /100 | #284 | Tragic $88,301 |
| Guatemalans | 0.1 /100 | #285 | Tragic $88,295 |
| Immigrants | Nicaragua | 0.1 /100 | #286 | Tragic $88,267 |
| Potawatomi | 0.1 /100 | #287 | Tragic $88,265 |