Potawatomi vs Iraqi Median Family Income
COMPARE
Potawatomi
Iraqi
Median Family Income
Median Family Income Comparison
Potawatomi
Iraqis
$88,265
MEDIAN FAMILY INCOME
0.1/ 100
METRIC RATING
287th/ 347
METRIC RANK
$100,658
MEDIAN FAMILY INCOME
26.3/ 100
METRIC RATING
193rd/ 347
METRIC RANK
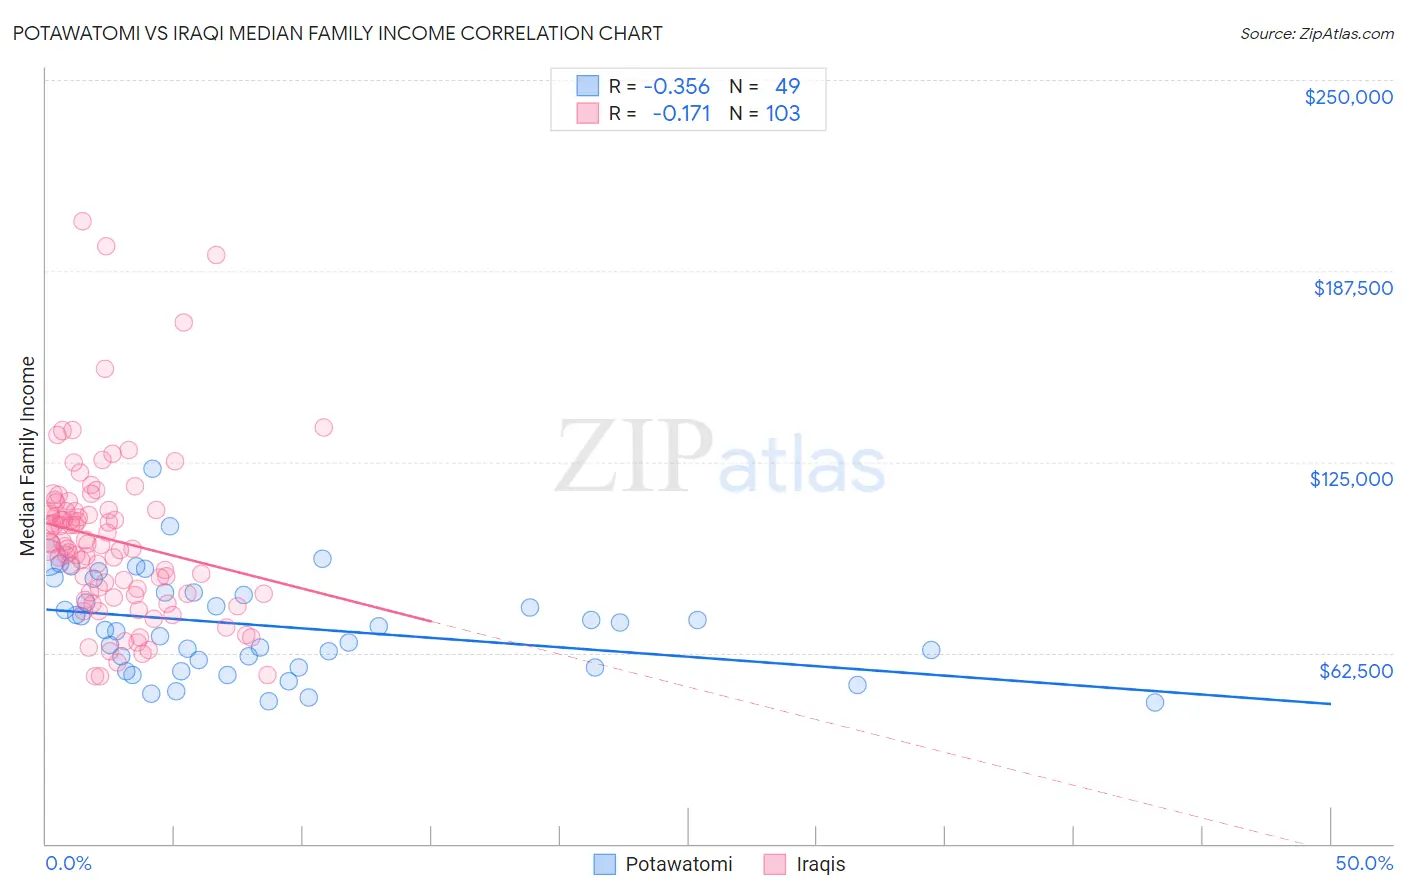
Potawatomi vs Iraqi Median Family Income Correlation Chart
The statistical analysis conducted on geographies consisting of 117,752,376 people shows a mild negative correlation between the proportion of Potawatomi and median family income in the United States with a correlation coefficient (R) of -0.356 and weighted average of $88,265. Similarly, the statistical analysis conducted on geographies consisting of 170,585,790 people shows a poor negative correlation between the proportion of Iraqis and median family income in the United States with a correlation coefficient (R) of -0.171 and weighted average of $100,658, a difference of 14.0%.
Median Family Income Correlation Summary
| Measurement | Potawatomi | Iraqi |
| Minimum | $46,250 | $54,690 |
| Maximum | $122,813 | $203,844 |
| Range | $76,563 | $149,154 |
| Mean | $71,315 | $99,589 |
| Median | $70,018 | $97,704 |
| Interquartile 25% (IQ1) | $57,500 | $81,823 |
| Interquartile 75% (IQ3) | $82,232 | $109,149 |
| Interquartile Range (IQR) | $24,732 | $27,326 |
| Standard Deviation (Sample) | $16,474 | $27,377 |
| Standard Deviation (Population) | $16,305 | $27,244 |
Similar Demographics by Median Family Income
Demographics Similar to Potawatomi by Median Family Income
In terms of median family income, the demographic groups most similar to Potawatomi are Immigrants from Nicaragua ($88,267, a difference of 0.0%), Guatemalan ($88,295, a difference of 0.030%), Indonesian ($88,301, a difference of 0.040%), Cherokee ($88,209, a difference of 0.060%), and Bangladeshi ($88,358, a difference of 0.11%).
| Demographics | Rating | Rank | Median Family Income |
| British West Indians | 0.1 /100 | #280 | Tragic $88,987 |
| Blackfeet | 0.1 /100 | #281 | Tragic $88,717 |
| Comanche | 0.1 /100 | #282 | Tragic $88,556 |
| Bangladeshis | 0.1 /100 | #283 | Tragic $88,358 |
| Indonesians | 0.1 /100 | #284 | Tragic $88,301 |
| Guatemalans | 0.1 /100 | #285 | Tragic $88,295 |
| Immigrants | Nicaragua | 0.1 /100 | #286 | Tragic $88,267 |
| Potawatomi | 0.1 /100 | #287 | Tragic $88,265 |
| Cherokee | 0.1 /100 | #288 | Tragic $88,209 |
| Central American Indians | 0.1 /100 | #289 | Tragic $88,034 |
| Shoshone | 0.1 /100 | #290 | Tragic $87,872 |
| Immigrants | Cabo Verde | 0.1 /100 | #291 | Tragic $87,830 |
| Africans | 0.1 /100 | #292 | Tragic $87,820 |
| Ute | 0.0 /100 | #293 | Tragic $87,596 |
| Fijians | 0.0 /100 | #294 | Tragic $87,387 |
Demographics Similar to Iraqis by Median Family Income
In terms of median family income, the demographic groups most similar to Iraqis are Uruguayan ($100,656, a difference of 0.0%), Immigrants from Kenya ($100,679, a difference of 0.020%), Colombian ($100,750, a difference of 0.090%), Immigrants from South America ($100,414, a difference of 0.24%), and Immigrants ($100,962, a difference of 0.30%).
| Demographics | Rating | Rank | Median Family Income |
| Celtics | 31.3 /100 | #186 | Fair $101,139 |
| Tlingit-Haida | 30.8 /100 | #187 | Fair $101,092 |
| Guamanians/Chamorros | 30.5 /100 | #188 | Fair $101,061 |
| Immigrants | Portugal | 29.6 /100 | #189 | Fair $100,984 |
| Immigrants | Immigrants | 29.4 /100 | #190 | Fair $100,962 |
| Colombians | 27.2 /100 | #191 | Fair $100,750 |
| Immigrants | Kenya | 26.5 /100 | #192 | Fair $100,679 |
| Iraqis | 26.3 /100 | #193 | Fair $100,658 |
| Uruguayans | 26.3 /100 | #194 | Fair $100,656 |
| Immigrants | South America | 23.9 /100 | #195 | Fair $100,414 |
| Samoans | 23.3 /100 | #196 | Fair $100,344 |
| Immigrants | Cameroon | 22.8 /100 | #197 | Fair $100,289 |
| Immigrants | Africa | 22.5 /100 | #198 | Fair $100,256 |
| Yugoslavians | 21.3 /100 | #199 | Fair $100,119 |
| Spanish | 20.1 /100 | #200 | Fair $99,977 |