Potawatomi vs Immigrants from Bulgaria Doctorate Degree
COMPARE
Potawatomi
Immigrants from Bulgaria
Doctorate Degree
Doctorate Degree Comparison
Potawatomi
Immigrants from Bulgaria
1.6%
DOCTORATE DEGREE
1.6/ 100
METRIC RATING
249th/ 347
METRIC RANK
2.3%
DOCTORATE DEGREE
99.8/ 100
METRIC RATING
73rd/ 347
METRIC RANK
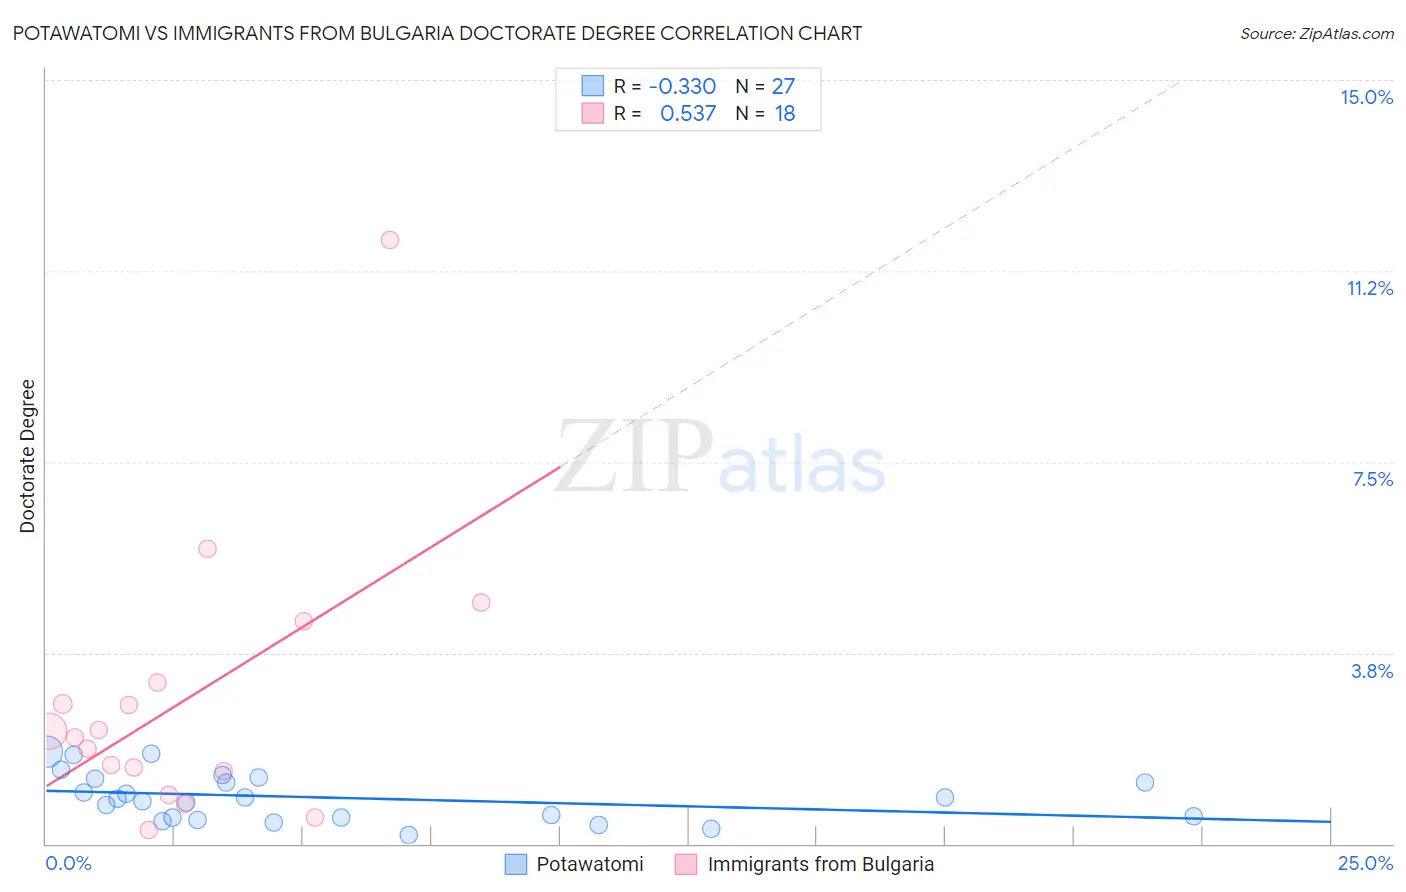
Potawatomi vs Immigrants from Bulgaria Doctorate Degree Correlation Chart
The statistical analysis conducted on geographies consisting of 116,746,073 people shows a mild negative correlation between the proportion of Potawatomi and percentage of population with at least doctorate degree education in the United States with a correlation coefficient (R) of -0.330 and weighted average of 1.6%. Similarly, the statistical analysis conducted on geographies consisting of 172,295,374 people shows a substantial positive correlation between the proportion of Immigrants from Bulgaria and percentage of population with at least doctorate degree education in the United States with a correlation coefficient (R) of 0.537 and weighted average of 2.3%, a difference of 44.3%.
Doctorate Degree Correlation Summary
| Measurement | Potawatomi | Immigrants from Bulgaria |
| Minimum | 0.18% | 0.26% |
| Maximum | 1.8% | 11.8% |
| Range | 1.6% | 11.6% |
| Mean | 0.91% | 2.8% |
| Median | 0.88% | 2.2% |
| Interquartile 25% (IQ1) | 0.51% | 1.4% |
| Interquartile 75% (IQ3) | 1.3% | 3.2% |
| Interquartile Range (IQR) | 0.78% | 1.7% |
| Standard Deviation (Sample) | 0.47% | 2.7% |
| Standard Deviation (Population) | 0.46% | 2.6% |
Similar Demographics by Doctorate Degree
Demographics Similar to Potawatomi by Doctorate Degree
In terms of doctorate degree, the demographic groups most similar to Potawatomi are Immigrants from Fiji (1.6%, a difference of 0.030%), African (1.6%, a difference of 0.47%), Comanche (1.6%, a difference of 0.59%), Hmong (1.6%, a difference of 0.61%), and Delaware (1.6%, a difference of 0.70%).
| Demographics | Rating | Rank | Doctorate Degree |
| Ottawa | 2.2 /100 | #242 | Tragic 1.6% |
| Native Hawaiians | 2.1 /100 | #243 | Tragic 1.6% |
| French American Indians | 2.0 /100 | #244 | Tragic 1.6% |
| Delaware | 1.9 /100 | #245 | Tragic 1.6% |
| Hmong | 1.8 /100 | #246 | Tragic 1.6% |
| Comanche | 1.8 /100 | #247 | Tragic 1.6% |
| Africans | 1.8 /100 | #248 | Tragic 1.6% |
| Potawatomi | 1.6 /100 | #249 | Tragic 1.6% |
| Immigrants | Fiji | 1.6 /100 | #250 | Tragic 1.6% |
| Apache | 1.3 /100 | #251 | Tragic 1.5% |
| Yuman | 1.1 /100 | #252 | Tragic 1.5% |
| Americans | 1.0 /100 | #253 | Tragic 1.5% |
| Immigrants | Cambodia | 1.0 /100 | #254 | Tragic 1.5% |
| Trinidadians and Tobagonians | 1.0 /100 | #255 | Tragic 1.5% |
| Central American Indians | 1.0 /100 | #256 | Tragic 1.5% |
Demographics Similar to Immigrants from Bulgaria by Doctorate Degree
In terms of doctorate degree, the demographic groups most similar to Immigrants from Bulgaria are Immigrants from Canada (2.3%, a difference of 0.080%), Immigrants from North America (2.2%, a difference of 0.14%), Lithuanian (2.3%, a difference of 0.24%), Immigrants from Bolivia (2.3%, a difference of 0.24%), and Immigrants from Western Asia (2.2%, a difference of 0.24%).
| Demographics | Rating | Rank | Doctorate Degree |
| Argentineans | 99.9 /100 | #66 | Exceptional 2.3% |
| Zimbabweans | 99.8 /100 | #67 | Exceptional 2.3% |
| Immigrants | Kazakhstan | 99.8 /100 | #68 | Exceptional 2.3% |
| Carpatho Rusyns | 99.8 /100 | #69 | Exceptional 2.3% |
| Lithuanians | 99.8 /100 | #70 | Exceptional 2.3% |
| Immigrants | Bolivia | 99.8 /100 | #71 | Exceptional 2.3% |
| Immigrants | Canada | 99.8 /100 | #72 | Exceptional 2.3% |
| Immigrants | Bulgaria | 99.8 /100 | #73 | Exceptional 2.3% |
| Immigrants | North America | 99.8 /100 | #74 | Exceptional 2.2% |
| Immigrants | Western Asia | 99.8 /100 | #75 | Exceptional 2.2% |
| Immigrants | Hungary | 99.8 /100 | #76 | Exceptional 2.2% |
| Immigrants | Lebanon | 99.8 /100 | #77 | Exceptional 2.2% |
| Immigrants | Belarus | 99.7 /100 | #78 | Exceptional 2.2% |
| Northern Europeans | 99.7 /100 | #79 | Exceptional 2.2% |
| Ugandans | 99.7 /100 | #80 | Exceptional 2.2% |