Potawatomi vs Korean Householder Income Ages 25 - 44 years
COMPARE
Potawatomi
Korean
Householder Income Ages 25 - 44 years
Householder Income Ages 25 - 44 years Comparison
Potawatomi
Koreans
$81,774
HOUSEHOLDER INCOME AGES 25 - 44 YEARS
0.1/ 100
METRIC RATING
291st/ 347
METRIC RANK
$103,824
HOUSEHOLDER INCOME AGES 25 - 44 YEARS
99.4/ 100
METRIC RATING
75th/ 347
METRIC RANK
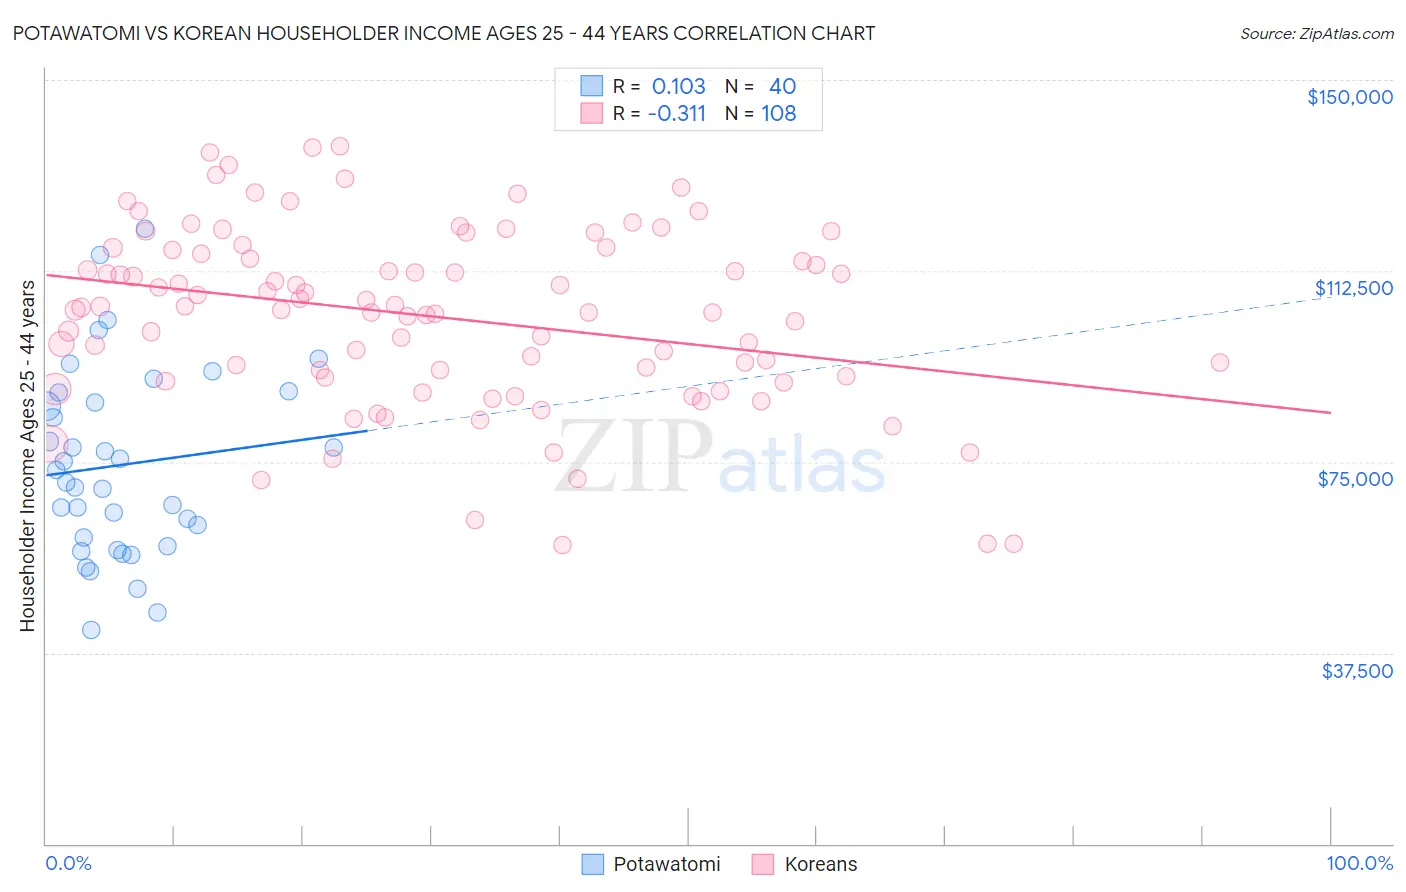
Potawatomi vs Korean Householder Income Ages 25 - 44 years Correlation Chart
The statistical analysis conducted on geographies consisting of 117,622,599 people shows a poor positive correlation between the proportion of Potawatomi and household income with householder between the ages 25 and 44 in the United States with a correlation coefficient (R) of 0.103 and weighted average of $81,774. Similarly, the statistical analysis conducted on geographies consisting of 508,598,360 people shows a mild negative correlation between the proportion of Koreans and household income with householder between the ages 25 and 44 in the United States with a correlation coefficient (R) of -0.311 and weighted average of $103,824, a difference of 27.0%.
Householder Income Ages 25 - 44 years Correlation Summary
| Measurement | Potawatomi | Korean |
| Minimum | $41,983 | $58,683 |
| Maximum | $120,714 | $137,023 |
| Range | $78,731 | $78,340 |
| Mean | $74,403 | $103,567 |
| Median | $72,124 | $105,054 |
| Interquartile 25% (IQ1) | $59,264 | $91,700 |
| Interquartile 75% (IQ3) | $87,578 | $116,277 |
| Interquartile Range (IQR) | $28,314 | $24,577 |
| Standard Deviation (Sample) | $18,398 | $17,535 |
| Standard Deviation (Population) | $18,166 | $17,454 |
Similar Demographics by Householder Income Ages 25 - 44 years
Demographics Similar to Potawatomi by Householder Income Ages 25 - 44 years
In terms of householder income ages 25 - 44 years, the demographic groups most similar to Potawatomi are Yaqui ($81,656, a difference of 0.14%), Liberian ($82,005, a difference of 0.28%), Blackfeet ($81,531, a difference of 0.30%), Shoshone ($82,062, a difference of 0.35%), and Cuban ($81,483, a difference of 0.36%).
| Demographics | Rating | Rank | Householder Income Ages 25 - 44 years |
| Immigrants | Middle Africa | 0.1 /100 | #284 | Tragic $82,254 |
| Immigrants | Somalia | 0.1 /100 | #285 | Tragic $82,188 |
| Ute | 0.1 /100 | #286 | Tragic $82,166 |
| Immigrants | Latin America | 0.1 /100 | #287 | Tragic $82,166 |
| Comanche | 0.1 /100 | #288 | Tragic $82,152 |
| Shoshone | 0.1 /100 | #289 | Tragic $82,062 |
| Liberians | 0.1 /100 | #290 | Tragic $82,005 |
| Potawatomi | 0.1 /100 | #291 | Tragic $81,774 |
| Yaqui | 0.1 /100 | #292 | Tragic $81,656 |
| Blackfeet | 0.1 /100 | #293 | Tragic $81,531 |
| Cubans | 0.1 /100 | #294 | Tragic $81,483 |
| Bangladeshis | 0.1 /100 | #295 | Tragic $81,363 |
| Immigrants | Dominica | 0.1 /100 | #296 | Tragic $81,351 |
| Immigrants | Guatemala | 0.1 /100 | #297 | Tragic $81,341 |
| Dominicans | 0.1 /100 | #298 | Tragic $81,229 |
Demographics Similar to Koreans by Householder Income Ages 25 - 44 years
In terms of householder income ages 25 - 44 years, the demographic groups most similar to Koreans are Immigrants from Spain ($103,752, a difference of 0.070%), Immigrants from Fiji ($103,954, a difference of 0.13%), Immigrants from Southern Europe ($103,486, a difference of 0.33%), Italian ($104,215, a difference of 0.38%), and Immigrants from Bulgaria ($103,423, a difference of 0.39%).
| Demographics | Rating | Rank | Householder Income Ages 25 - 44 years |
| Immigrants | Eastern Europe | 99.6 /100 | #68 | Exceptional $104,662 |
| Mongolians | 99.6 /100 | #69 | Exceptional $104,578 |
| Immigrants | Croatia | 99.6 /100 | #70 | Exceptional $104,503 |
| Afghans | 99.6 /100 | #71 | Exceptional $104,410 |
| Chinese | 99.5 /100 | #72 | Exceptional $104,264 |
| Italians | 99.5 /100 | #73 | Exceptional $104,215 |
| Immigrants | Fiji | 99.5 /100 | #74 | Exceptional $103,954 |
| Koreans | 99.4 /100 | #75 | Exceptional $103,824 |
| Immigrants | Spain | 99.4 /100 | #76 | Exceptional $103,752 |
| Immigrants | Southern Europe | 99.3 /100 | #77 | Exceptional $103,486 |
| Immigrants | Bulgaria | 99.3 /100 | #78 | Exceptional $103,423 |
| Armenians | 99.2 /100 | #79 | Exceptional $103,248 |
| Immigrants | Egypt | 99.2 /100 | #80 | Exceptional $103,192 |
| South Africans | 99.2 /100 | #81 | Exceptional $103,160 |
| Immigrants | Serbia | 99.2 /100 | #82 | Exceptional $103,155 |