Potawatomi vs Turkish Householder Income Ages 25 - 44 years
COMPARE
Potawatomi
Turkish
Householder Income Ages 25 - 44 years
Householder Income Ages 25 - 44 years Comparison
Potawatomi
Turks
$81,774
HOUSEHOLDER INCOME AGES 25 - 44 YEARS
0.1/ 100
METRIC RATING
291st/ 347
METRIC RANK
$110,318
HOUSEHOLDER INCOME AGES 25 - 44 YEARS
100.0/ 100
METRIC RATING
29th/ 347
METRIC RANK
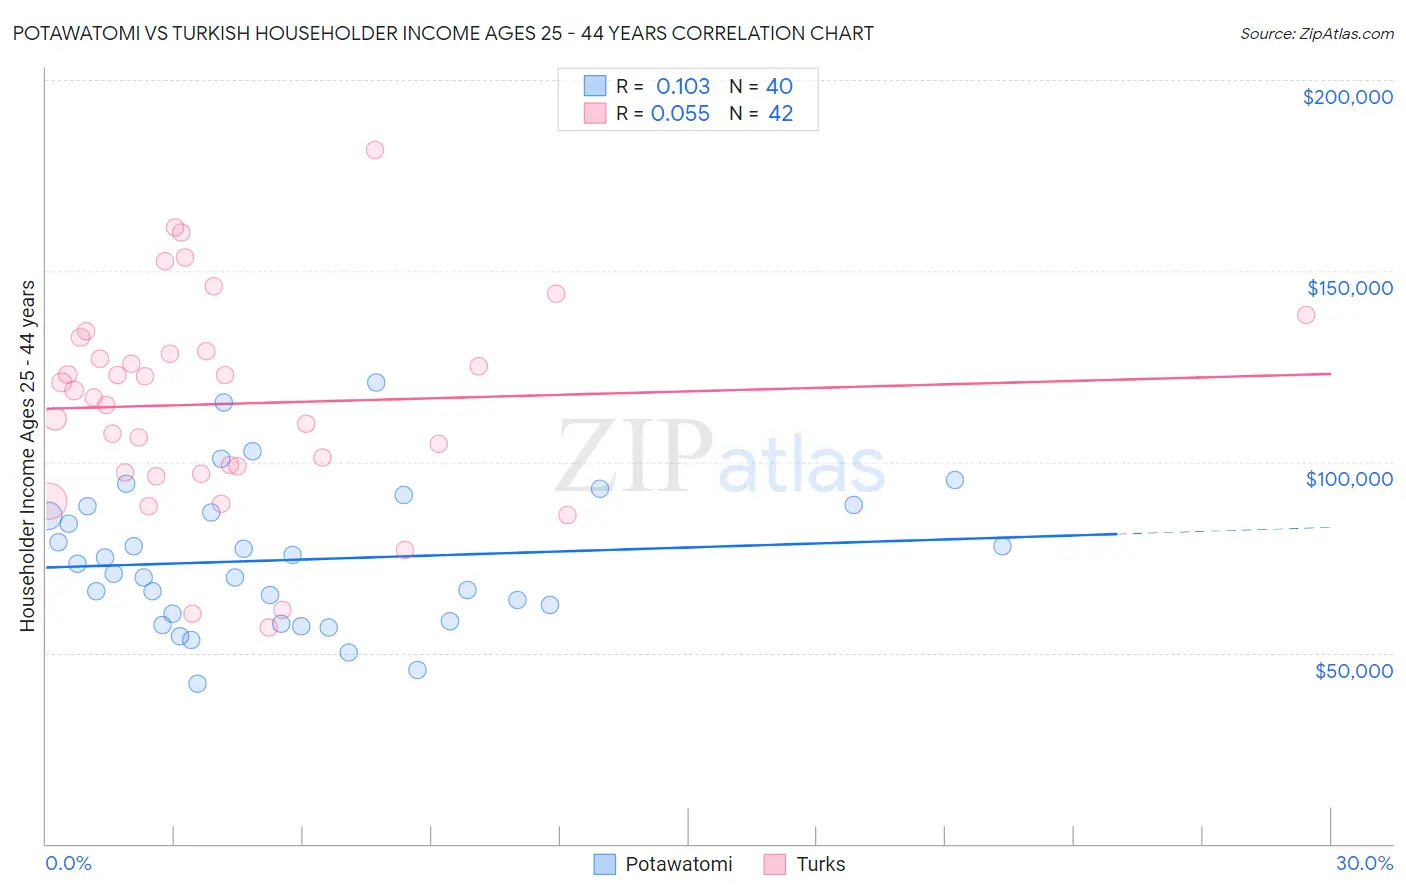
Potawatomi vs Turkish Householder Income Ages 25 - 44 years Correlation Chart
The statistical analysis conducted on geographies consisting of 117,622,599 people shows a poor positive correlation between the proportion of Potawatomi and household income with householder between the ages 25 and 44 in the United States with a correlation coefficient (R) of 0.103 and weighted average of $81,774. Similarly, the statistical analysis conducted on geographies consisting of 271,426,496 people shows a slight positive correlation between the proportion of Turks and household income with householder between the ages 25 and 44 in the United States with a correlation coefficient (R) of 0.055 and weighted average of $110,318, a difference of 34.9%.
Householder Income Ages 25 - 44 years Correlation Summary
| Measurement | Potawatomi | Turkish |
| Minimum | $41,983 | $56,649 |
| Maximum | $120,714 | $181,667 |
| Range | $78,731 | $125,018 |
| Mean | $74,403 | $115,234 |
| Median | $72,124 | $117,840 |
| Interquartile 25% (IQ1) | $59,264 | $97,323 |
| Interquartile 75% (IQ3) | $87,578 | $128,924 |
| Interquartile Range (IQR) | $28,314 | $31,602 |
| Standard Deviation (Sample) | $18,398 | $27,559 |
| Standard Deviation (Population) | $18,166 | $27,229 |
Similar Demographics by Householder Income Ages 25 - 44 years
Demographics Similar to Potawatomi by Householder Income Ages 25 - 44 years
In terms of householder income ages 25 - 44 years, the demographic groups most similar to Potawatomi are Yaqui ($81,656, a difference of 0.14%), Liberian ($82,005, a difference of 0.28%), Blackfeet ($81,531, a difference of 0.30%), Shoshone ($82,062, a difference of 0.35%), and Cuban ($81,483, a difference of 0.36%).
| Demographics | Rating | Rank | Householder Income Ages 25 - 44 years |
| Immigrants | Middle Africa | 0.1 /100 | #284 | Tragic $82,254 |
| Immigrants | Somalia | 0.1 /100 | #285 | Tragic $82,188 |
| Ute | 0.1 /100 | #286 | Tragic $82,166 |
| Immigrants | Latin America | 0.1 /100 | #287 | Tragic $82,166 |
| Comanche | 0.1 /100 | #288 | Tragic $82,152 |
| Shoshone | 0.1 /100 | #289 | Tragic $82,062 |
| Liberians | 0.1 /100 | #290 | Tragic $82,005 |
| Potawatomi | 0.1 /100 | #291 | Tragic $81,774 |
| Yaqui | 0.1 /100 | #292 | Tragic $81,656 |
| Blackfeet | 0.1 /100 | #293 | Tragic $81,531 |
| Cubans | 0.1 /100 | #294 | Tragic $81,483 |
| Bangladeshis | 0.1 /100 | #295 | Tragic $81,363 |
| Immigrants | Dominica | 0.1 /100 | #296 | Tragic $81,351 |
| Immigrants | Guatemala | 0.1 /100 | #297 | Tragic $81,341 |
| Dominicans | 0.1 /100 | #298 | Tragic $81,229 |
Demographics Similar to Turks by Householder Income Ages 25 - 44 years
In terms of householder income ages 25 - 44 years, the demographic groups most similar to Turks are Immigrants from Denmark ($110,363, a difference of 0.040%), Russian ($110,398, a difference of 0.070%), Immigrants from Greece ($110,103, a difference of 0.20%), Maltese ($110,064, a difference of 0.23%), and Immigrants from Asia ($110,787, a difference of 0.42%).
| Demographics | Rating | Rank | Householder Income Ages 25 - 44 years |
| Immigrants | Belgium | 100.0 /100 | #22 | Exceptional $112,575 |
| Immigrants | Japan | 100.0 /100 | #23 | Exceptional $112,228 |
| Immigrants | Sweden | 100.0 /100 | #24 | Exceptional $112,010 |
| Immigrants | Northern Europe | 100.0 /100 | #25 | Exceptional $111,676 |
| Immigrants | Asia | 100.0 /100 | #26 | Exceptional $110,787 |
| Russians | 100.0 /100 | #27 | Exceptional $110,398 |
| Immigrants | Denmark | 100.0 /100 | #28 | Exceptional $110,363 |
| Turks | 100.0 /100 | #29 | Exceptional $110,318 |
| Immigrants | Greece | 100.0 /100 | #30 | Exceptional $110,103 |
| Maltese | 100.0 /100 | #31 | Exceptional $110,064 |
| Immigrants | Sri Lanka | 100.0 /100 | #32 | Exceptional $109,741 |
| Bhutanese | 100.0 /100 | #33 | Exceptional $109,520 |
| Bolivians | 100.0 /100 | #34 | Exceptional $109,372 |
| Immigrants | Switzerland | 100.0 /100 | #35 | Exceptional $109,185 |
| Latvians | 100.0 /100 | #36 | Exceptional $108,926 |