Potawatomi vs Immigrants from Armenia Householder Income Ages 25 - 44 years
COMPARE
Potawatomi
Immigrants from Armenia
Householder Income Ages 25 - 44 years
Householder Income Ages 25 - 44 years Comparison
Potawatomi
Immigrants from Armenia
$81,774
HOUSEHOLDER INCOME AGES 25 - 44 YEARS
0.1/ 100
METRIC RATING
291st/ 347
METRIC RANK
$94,867
HOUSEHOLDER INCOME AGES 25 - 44 YEARS
54.2/ 100
METRIC RATING
171st/ 347
METRIC RANK
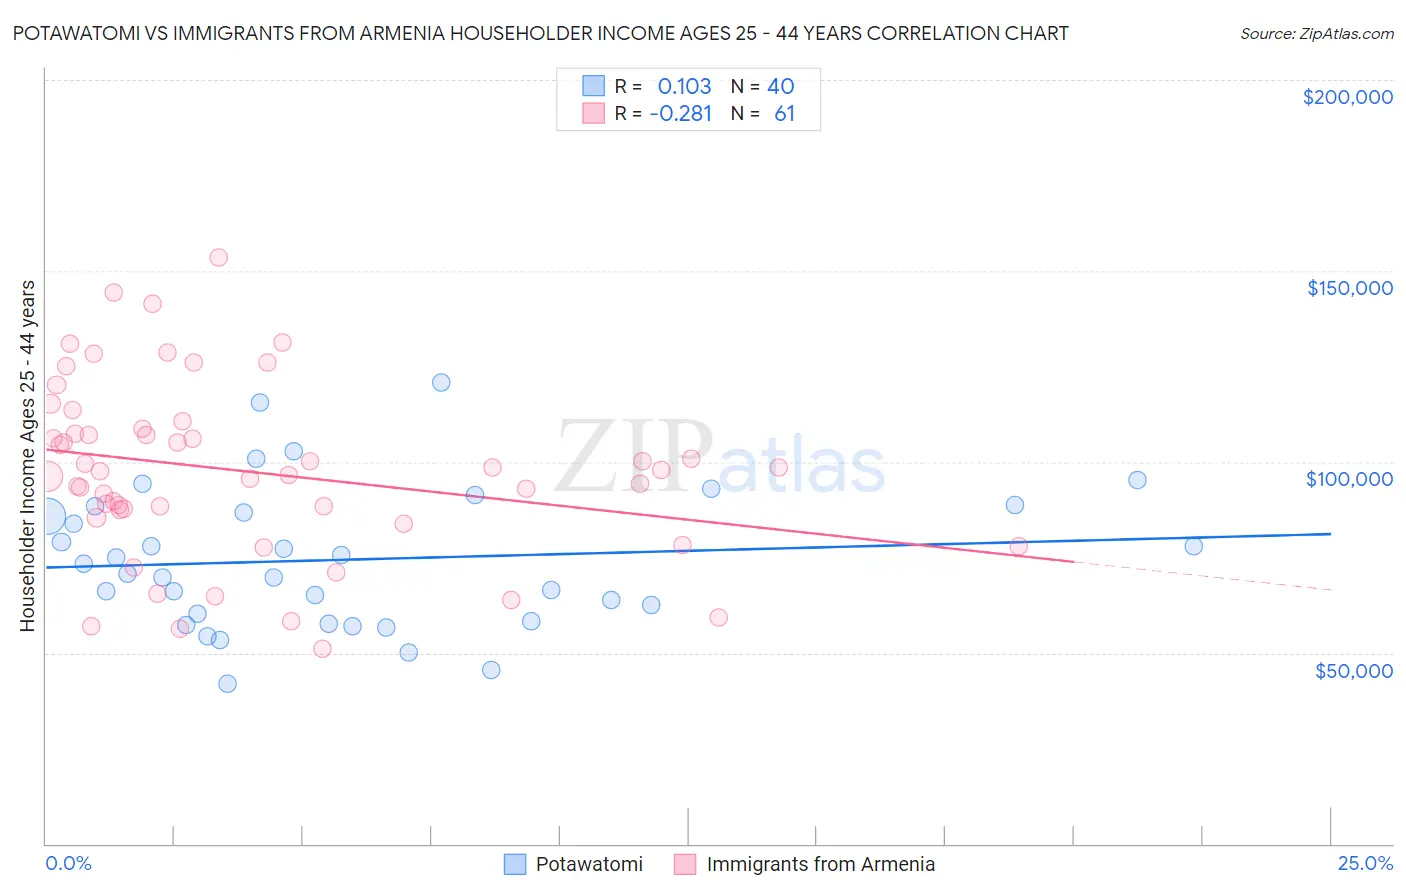
Potawatomi vs Immigrants from Armenia Householder Income Ages 25 - 44 years Correlation Chart
The statistical analysis conducted on geographies consisting of 117,622,599 people shows a poor positive correlation between the proportion of Potawatomi and household income with householder between the ages 25 and 44 in the United States with a correlation coefficient (R) of 0.103 and weighted average of $81,774. Similarly, the statistical analysis conducted on geographies consisting of 97,704,763 people shows a weak negative correlation between the proportion of Immigrants from Armenia and household income with householder between the ages 25 and 44 in the United States with a correlation coefficient (R) of -0.281 and weighted average of $94,867, a difference of 16.0%.
Householder Income Ages 25 - 44 years Correlation Summary
| Measurement | Potawatomi | Immigrants from Armenia |
| Minimum | $41,983 | $50,938 |
| Maximum | $120,714 | $153,486 |
| Range | $78,731 | $102,548 |
| Mean | $74,403 | $97,387 |
| Median | $72,124 | $97,643 |
| Interquartile 25% (IQ1) | $59,264 | $86,360 |
| Interquartile 75% (IQ3) | $87,578 | $108,002 |
| Interquartile Range (IQR) | $28,314 | $21,642 |
| Standard Deviation (Sample) | $18,398 | $22,751 |
| Standard Deviation (Population) | $18,166 | $22,564 |
Similar Demographics by Householder Income Ages 25 - 44 years
Demographics Similar to Potawatomi by Householder Income Ages 25 - 44 years
In terms of householder income ages 25 - 44 years, the demographic groups most similar to Potawatomi are Yaqui ($81,656, a difference of 0.14%), Liberian ($82,005, a difference of 0.28%), Blackfeet ($81,531, a difference of 0.30%), Shoshone ($82,062, a difference of 0.35%), and Cuban ($81,483, a difference of 0.36%).
| Demographics | Rating | Rank | Householder Income Ages 25 - 44 years |
| Immigrants | Middle Africa | 0.1 /100 | #284 | Tragic $82,254 |
| Immigrants | Somalia | 0.1 /100 | #285 | Tragic $82,188 |
| Ute | 0.1 /100 | #286 | Tragic $82,166 |
| Immigrants | Latin America | 0.1 /100 | #287 | Tragic $82,166 |
| Comanche | 0.1 /100 | #288 | Tragic $82,152 |
| Shoshone | 0.1 /100 | #289 | Tragic $82,062 |
| Liberians | 0.1 /100 | #290 | Tragic $82,005 |
| Potawatomi | 0.1 /100 | #291 | Tragic $81,774 |
| Yaqui | 0.1 /100 | #292 | Tragic $81,656 |
| Blackfeet | 0.1 /100 | #293 | Tragic $81,531 |
| Cubans | 0.1 /100 | #294 | Tragic $81,483 |
| Bangladeshis | 0.1 /100 | #295 | Tragic $81,363 |
| Immigrants | Dominica | 0.1 /100 | #296 | Tragic $81,351 |
| Immigrants | Guatemala | 0.1 /100 | #297 | Tragic $81,341 |
| Dominicans | 0.1 /100 | #298 | Tragic $81,229 |
Demographics Similar to Immigrants from Armenia by Householder Income Ages 25 - 44 years
In terms of householder income ages 25 - 44 years, the demographic groups most similar to Immigrants from Armenia are Slovak ($95,032, a difference of 0.17%), Alsatian ($95,059, a difference of 0.20%), Native Hawaiian ($95,058, a difference of 0.20%), Czechoslovakian ($95,070, a difference of 0.21%), and Scottish ($94,622, a difference of 0.26%).
| Demographics | Rating | Rank | Householder Income Ages 25 - 44 years |
| South Americans | 60.9 /100 | #164 | Good $95,362 |
| Immigrants | Nepal | 60.3 /100 | #165 | Good $95,322 |
| Immigrants | Ethiopia | 59.5 /100 | #166 | Average $95,256 |
| Czechoslovakians | 57.0 /100 | #167 | Average $95,070 |
| Alsatians | 56.8 /100 | #168 | Average $95,059 |
| Native Hawaiians | 56.8 /100 | #169 | Average $95,058 |
| Slovaks | 56.4 /100 | #170 | Average $95,032 |
| Immigrants | Armenia | 54.2 /100 | #171 | Average $94,867 |
| Scottish | 50.8 /100 | #172 | Average $94,622 |
| Finns | 50.6 /100 | #173 | Average $94,610 |
| Colombians | 50.0 /100 | #174 | Average $94,565 |
| English | 48.1 /100 | #175 | Average $94,429 |
| Immigrants | Immigrants | 48.0 /100 | #176 | Average $94,423 |
| Belgians | 45.8 /100 | #177 | Average $94,262 |
| Immigrants | South America | 42.8 /100 | #178 | Average $94,042 |