Potawatomi vs Guyanese Median Female Earnings
COMPARE
Potawatomi
Guyanese
Median Female Earnings
Median Female Earnings Comparison
Potawatomi
Guyanese
$34,739
MEDIAN FEMALE EARNINGS
0.0/ 100
METRIC RATING
317th/ 347
METRIC RANK
$40,973
MEDIAN FEMALE EARNINGS
93.4/ 100
METRIC RATING
123rd/ 347
METRIC RANK
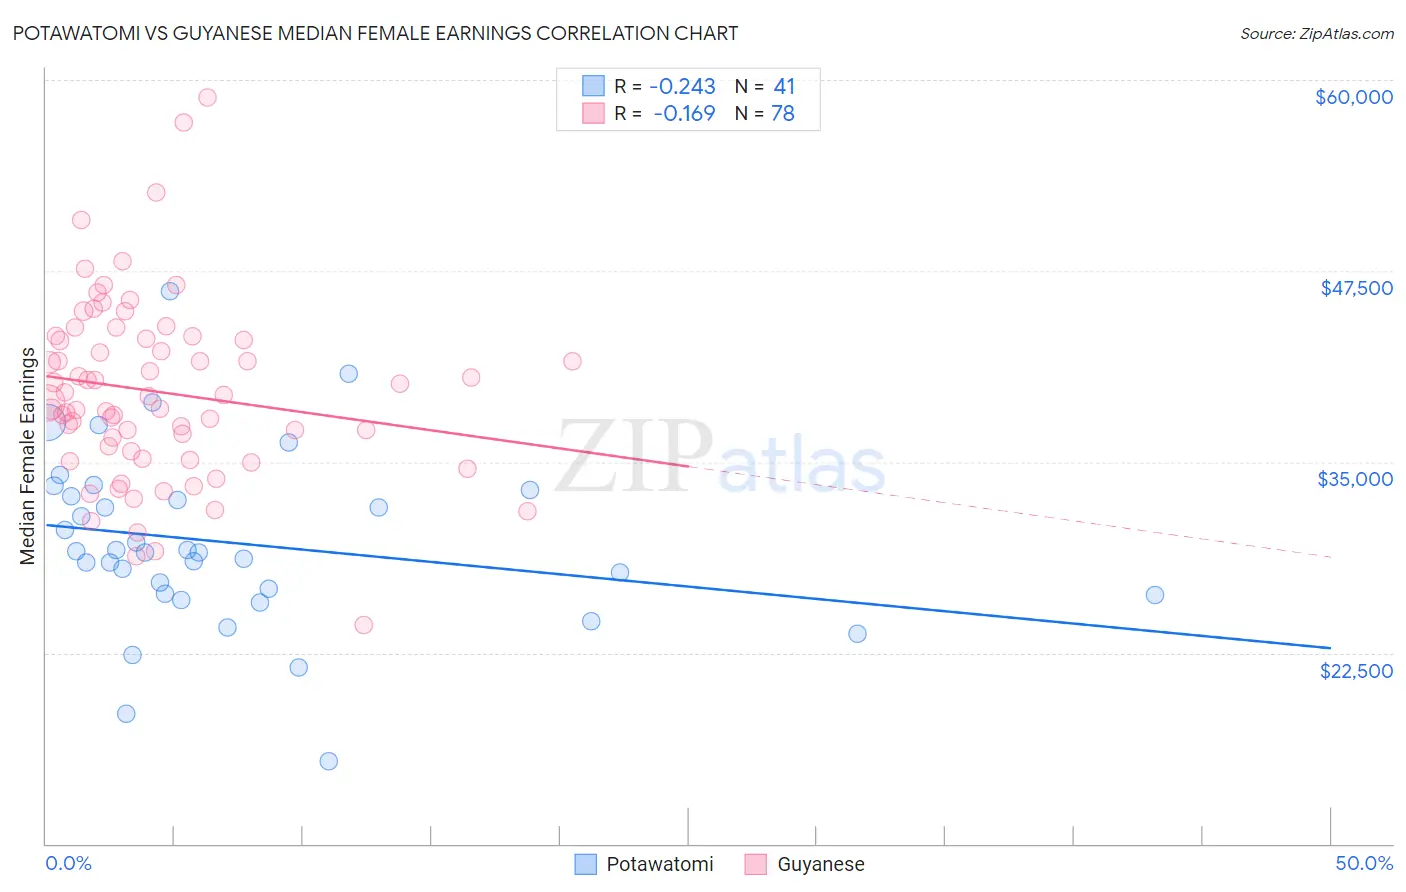
Potawatomi vs Guyanese Median Female Earnings Correlation Chart
The statistical analysis conducted on geographies consisting of 117,757,146 people shows a weak negative correlation between the proportion of Potawatomi and median female earnings in the United States with a correlation coefficient (R) of -0.243 and weighted average of $34,739. Similarly, the statistical analysis conducted on geographies consisting of 176,910,004 people shows a poor negative correlation between the proportion of Guyanese and median female earnings in the United States with a correlation coefficient (R) of -0.169 and weighted average of $40,973, a difference of 17.9%.
Median Female Earnings Correlation Summary
| Measurement | Potawatomi | Guyanese |
| Minimum | $15,417 | $24,336 |
| Maximum | $46,172 | $58,839 |
| Range | $30,755 | $34,503 |
| Mean | $29,667 | $39,580 |
| Median | $29,066 | $39,093 |
| Interquartile 25% (IQ1) | $26,292 | $35,732 |
| Interquartile 75% (IQ3) | $32,931 | $43,057 |
| Interquartile Range (IQR) | $6,639 | $7,325 |
| Standard Deviation (Sample) | $5,830 | $6,016 |
| Standard Deviation (Population) | $5,758 | $5,977 |
Similar Demographics by Median Female Earnings
Demographics Similar to Potawatomi by Median Female Earnings
In terms of median female earnings, the demographic groups most similar to Potawatomi are Cherokee ($34,742, a difference of 0.010%), Immigrants from Yemen ($34,693, a difference of 0.13%), Pennsylvania German ($34,802, a difference of 0.18%), Shoshone ($34,677, a difference of 0.18%), and Immigrants from Honduras ($34,647, a difference of 0.27%).
| Demographics | Rating | Rank | Median Female Earnings |
| Chippewa | 0.0 /100 | #310 | Tragic $35,003 |
| Ute | 0.0 /100 | #311 | Tragic $34,960 |
| Yaqui | 0.0 /100 | #312 | Tragic $34,943 |
| Cubans | 0.0 /100 | #313 | Tragic $34,942 |
| Apache | 0.0 /100 | #314 | Tragic $34,895 |
| Pennsylvania Germans | 0.0 /100 | #315 | Tragic $34,802 |
| Cherokee | 0.0 /100 | #316 | Tragic $34,742 |
| Potawatomi | 0.0 /100 | #317 | Tragic $34,739 |
| Immigrants | Yemen | 0.0 /100 | #318 | Tragic $34,693 |
| Shoshone | 0.0 /100 | #319 | Tragic $34,677 |
| Immigrants | Honduras | 0.0 /100 | #320 | Tragic $34,647 |
| Hispanics or Latinos | 0.0 /100 | #321 | Tragic $34,421 |
| Chickasaw | 0.0 /100 | #322 | Tragic $34,414 |
| Seminole | 0.0 /100 | #323 | Tragic $34,385 |
| Immigrants | Congo | 0.0 /100 | #324 | Tragic $34,317 |
Demographics Similar to Guyanese by Median Female Earnings
In terms of median female earnings, the demographic groups most similar to Guyanese are Immigrants from Jordan ($40,977, a difference of 0.010%), Trinidadian and Tobagonian ($40,958, a difference of 0.040%), Croatian ($40,993, a difference of 0.050%), Austrian ($40,923, a difference of 0.12%), and Immigrants from Trinidad and Tobago ($40,895, a difference of 0.19%).
| Demographics | Rating | Rank | Median Female Earnings |
| Immigrants | Brazil | 96.4 /100 | #116 | Exceptional $41,273 |
| Barbadians | 96.3 /100 | #117 | Exceptional $41,261 |
| Immigrants | Lebanon | 95.6 /100 | #118 | Exceptional $41,183 |
| Immigrants | Philippines | 95.0 /100 | #119 | Exceptional $41,114 |
| Immigrants | Kuwait | 94.4 /100 | #120 | Exceptional $41,055 |
| Croatians | 93.7 /100 | #121 | Exceptional $40,993 |
| Immigrants | Jordan | 93.5 /100 | #122 | Exceptional $40,977 |
| Guyanese | 93.4 /100 | #123 | Exceptional $40,973 |
| Trinidadians and Tobagonians | 93.2 /100 | #124 | Exceptional $40,958 |
| Austrians | 92.7 /100 | #125 | Exceptional $40,923 |
| Immigrants | Trinidad and Tobago | 92.3 /100 | #126 | Exceptional $40,895 |
| Ugandans | 92.2 /100 | #127 | Exceptional $40,889 |
| Carpatho Rusyns | 91.2 /100 | #128 | Exceptional $40,825 |
| Zimbabweans | 90.8 /100 | #129 | Exceptional $40,798 |
| Immigrants | Guyana | 90.3 /100 | #130 | Exceptional $40,773 |