Immigrants from Pakistan vs Greek Median Female Earnings
COMPARE
Immigrants from Pakistan
Greek
Median Female Earnings
Median Female Earnings Comparison
Immigrants from Pakistan
Greeks
$43,052
MEDIAN FEMALE EARNINGS
99.9/ 100
METRIC RATING
64th/ 347
METRIC RANK
$42,336
MEDIAN FEMALE EARNINGS
99.6/ 100
METRIC RATING
79th/ 347
METRIC RANK
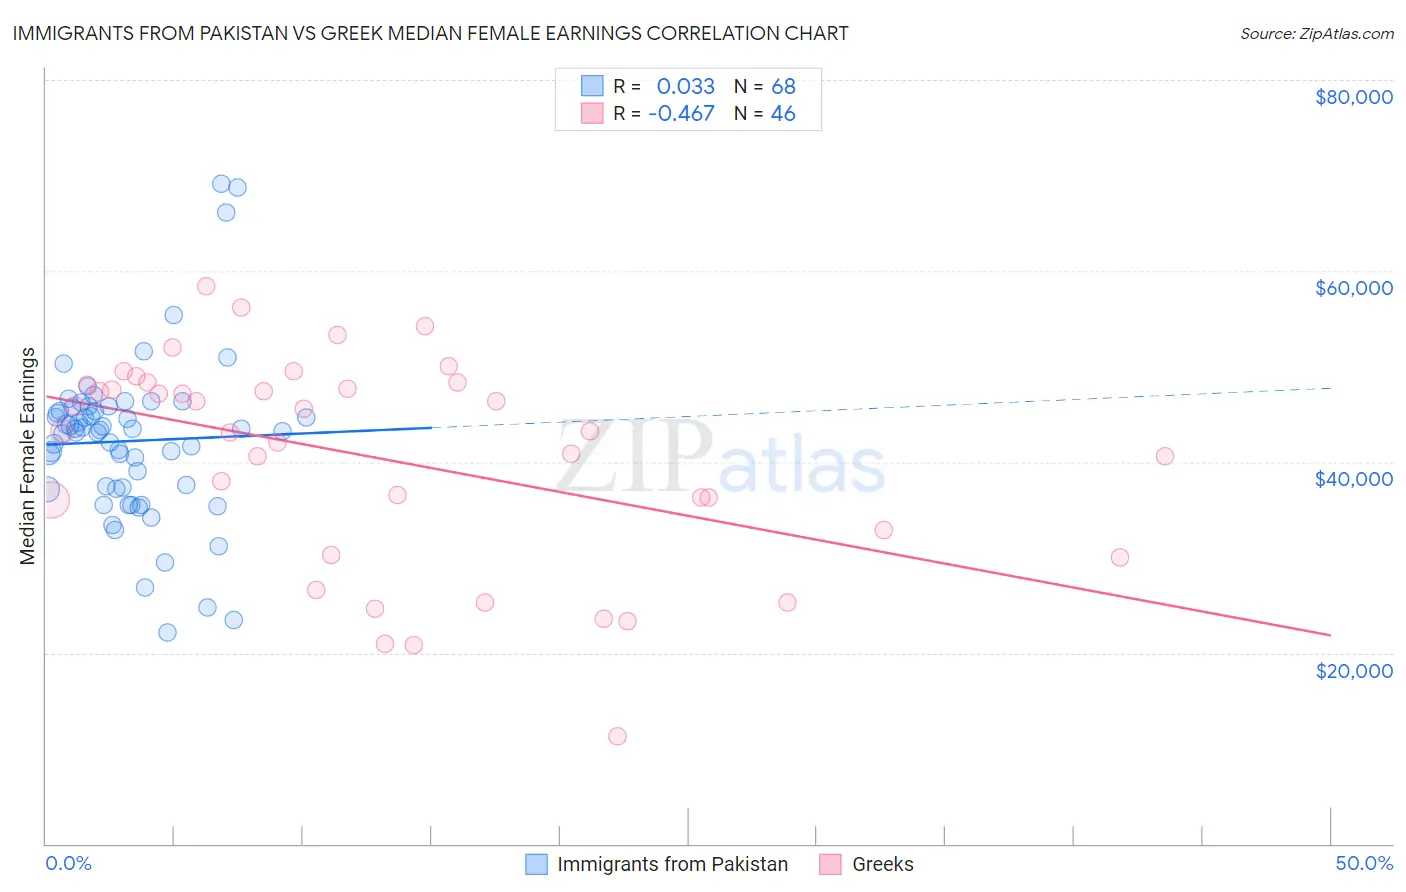
Immigrants from Pakistan vs Greek Median Female Earnings Correlation Chart
The statistical analysis conducted on geographies consisting of 283,887,032 people shows no correlation between the proportion of Immigrants from Pakistan and median female earnings in the United States with a correlation coefficient (R) of 0.033 and weighted average of $43,052. Similarly, the statistical analysis conducted on geographies consisting of 482,348,495 people shows a moderate negative correlation between the proportion of Greeks and median female earnings in the United States with a correlation coefficient (R) of -0.467 and weighted average of $42,336, a difference of 1.7%.
Median Female Earnings Correlation Summary
| Measurement | Immigrants from Pakistan | Greek |
| Minimum | $22,138 | $11,250 |
| Maximum | $69,138 | $58,379 |
| Range | $47,000 | $47,129 |
| Mean | $42,182 | $40,351 |
| Median | $43,220 | $43,165 |
| Interquartile 25% (IQ1) | $37,265 | $32,889 |
| Interquartile 75% (IQ3) | $45,503 | $48,068 |
| Interquartile Range (IQR) | $8,238 | $15,179 |
| Standard Deviation (Sample) | $8,546 | $10,999 |
| Standard Deviation (Population) | $8,483 | $10,879 |
Demographics Similar to Immigrants from Pakistan and Greeks by Median Female Earnings
In terms of median female earnings, the demographic groups most similar to Immigrants from Pakistan are Immigrants from Ukraine ($43,069, a difference of 0.040%), Afghan ($43,077, a difference of 0.060%), Immigrants from Bulgaria ($43,085, a difference of 0.080%), Sierra Leonean ($42,868, a difference of 0.43%), and Immigrants from Norway ($42,837, a difference of 0.50%). Similarly, the demographic groups most similar to Greeks are Immigrants from Moldova ($42,304, a difference of 0.080%), Immigrants from Albania ($42,388, a difference of 0.12%), Immigrants from Kazakhstan ($42,386, a difference of 0.12%), Immigrants from Southern Europe ($42,275, a difference of 0.15%), and New Zealander ($42,446, a difference of 0.26%).
| Demographics | Rating | Rank | Median Female Earnings |
| Immigrants | Bulgaria | 99.9 /100 | #61 | Exceptional $43,085 |
| Afghans | 99.9 /100 | #62 | Exceptional $43,077 |
| Immigrants | Ukraine | 99.9 /100 | #63 | Exceptional $43,069 |
| Immigrants | Pakistan | 99.9 /100 | #64 | Exceptional $43,052 |
| Sierra Leoneans | 99.9 /100 | #65 | Exceptional $42,868 |
| Immigrants | Norway | 99.9 /100 | #66 | Exceptional $42,837 |
| Immigrants | Egypt | 99.9 /100 | #67 | Exceptional $42,837 |
| Immigrants | Austria | 99.8 /100 | #68 | Exceptional $42,824 |
| Immigrants | Spain | 99.8 /100 | #69 | Exceptional $42,815 |
| Immigrants | Ethiopia | 99.8 /100 | #70 | Exceptional $42,744 |
| Immigrants | Romania | 99.8 /100 | #71 | Exceptional $42,718 |
| Albanians | 99.8 /100 | #72 | Exceptional $42,584 |
| Mongolians | 99.7 /100 | #73 | Exceptional $42,542 |
| Immigrants | South Africa | 99.7 /100 | #74 | Exceptional $42,508 |
| New Zealanders | 99.7 /100 | #75 | Exceptional $42,446 |
| Immigrants | Italy | 99.7 /100 | #76 | Exceptional $42,446 |
| Immigrants | Albania | 99.6 /100 | #77 | Exceptional $42,388 |
| Immigrants | Kazakhstan | 99.6 /100 | #78 | Exceptional $42,386 |
| Greeks | 99.6 /100 | #79 | Exceptional $42,336 |
| Immigrants | Moldova | 99.6 /100 | #80 | Exceptional $42,304 |
| Immigrants | Southern Europe | 99.5 /100 | #81 | Exceptional $42,275 |