Immigrants from Serbia vs New Zealander Per Capita Income
COMPARE
Immigrants from Serbia
New Zealander
Per Capita Income
Per Capita Income Comparison
Immigrants from Serbia
New Zealanders
$50,810
PER CAPITA INCOME
100.0/ 100
METRIC RATING
48th/ 347
METRIC RANK
$50,575
PER CAPITA INCOME
100.0/ 100
METRIC RATING
49th/ 347
METRIC RANK
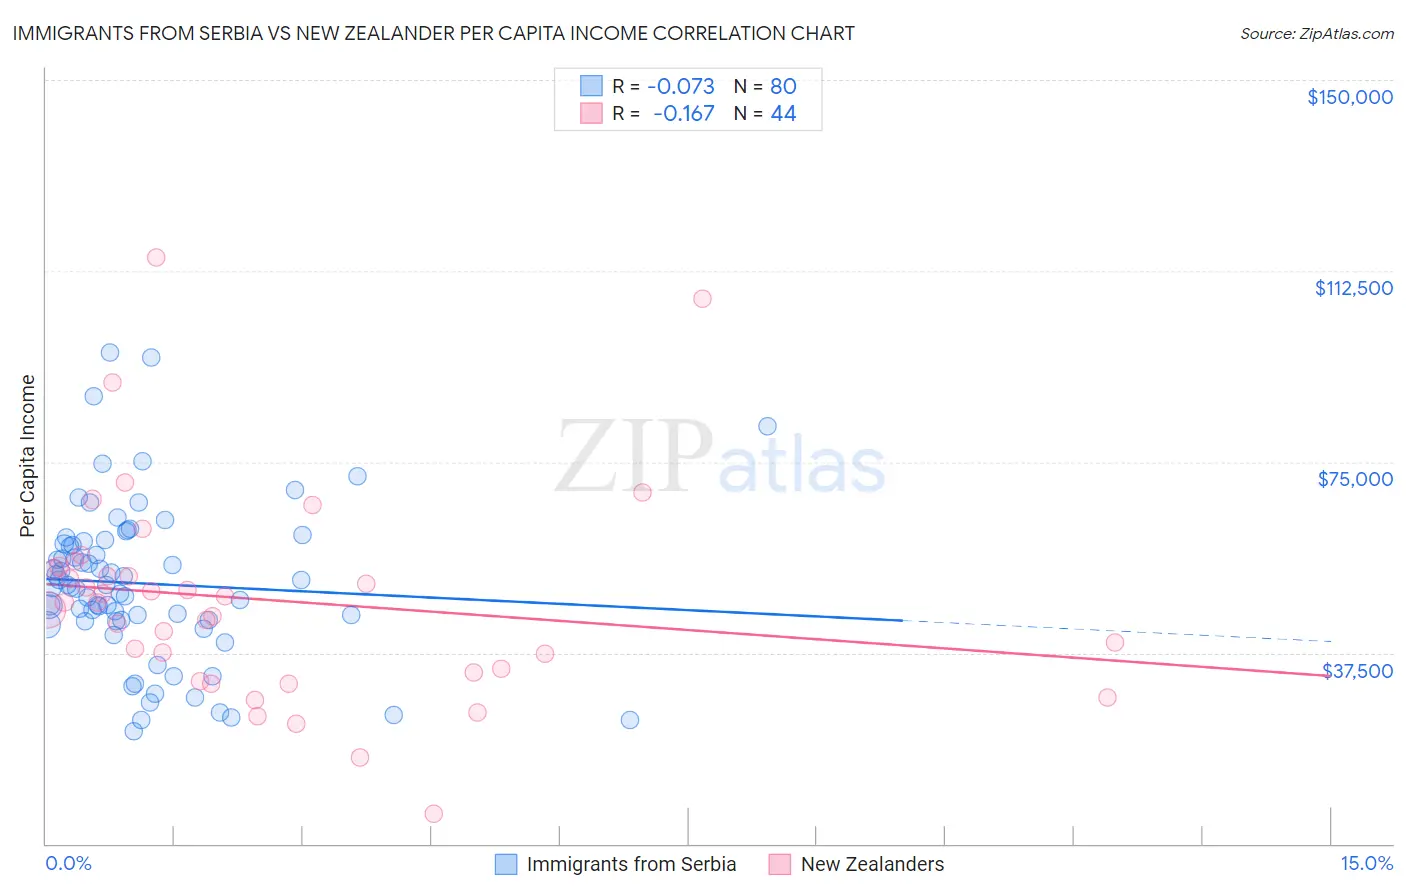
Immigrants from Serbia vs New Zealander Per Capita Income Correlation Chart
The statistical analysis conducted on geographies consisting of 131,748,543 people shows a slight negative correlation between the proportion of Immigrants from Serbia and per capita income in the United States with a correlation coefficient (R) of -0.073 and weighted average of $50,810. Similarly, the statistical analysis conducted on geographies consisting of 106,919,498 people shows a poor negative correlation between the proportion of New Zealanders and per capita income in the United States with a correlation coefficient (R) of -0.167 and weighted average of $50,575, a difference of 0.46%.
Per Capita Income Correlation Summary
| Measurement | Immigrants from Serbia | New Zealander |
| Minimum | $22,149 | $5,784 |
| Maximum | $96,565 | $115,097 |
| Range | $74,416 | $109,313 |
| Mean | $51,095 | $47,922 |
| Median | $50,532 | $47,389 |
| Interquartile 25% (IQ1) | $43,814 | $34,042 |
| Interquartile 75% (IQ3) | $59,208 | $54,179 |
| Interquartile Range (IQR) | $15,394 | $20,137 |
| Standard Deviation (Sample) | $15,421 | $20,895 |
| Standard Deviation (Population) | $15,324 | $20,656 |
Demographics Similar to Immigrants from Serbia and New Zealanders by Per Capita Income
In terms of per capita income, the demographic groups most similar to Immigrants from Serbia are Bulgarian ($50,906, a difference of 0.19%), Immigrants from Latvia ($50,914, a difference of 0.21%), Immigrants from Spain ($50,933, a difference of 0.24%), Immigrants from Europe ($50,950, a difference of 0.28%), and Immigrants from Sri Lanka ($50,555, a difference of 0.50%). Similarly, the demographic groups most similar to New Zealanders are Immigrants from Sri Lanka ($50,555, a difference of 0.040%), Immigrants from Netherlands ($50,458, a difference of 0.23%), Immigrants from Croatia ($50,417, a difference of 0.31%), Paraguayan ($50,385, a difference of 0.38%), and Immigrants from Belarus ($50,303, a difference of 0.54%).
| Demographics | Rating | Rank | Per Capita Income |
| Immigrants | Czechoslovakia | 100.0 /100 | #38 | Exceptional $51,770 |
| Cambodians | 100.0 /100 | #39 | Exceptional $51,731 |
| Immigrants | Korea | 100.0 /100 | #40 | Exceptional $51,671 |
| Immigrants | South Africa | 100.0 /100 | #41 | Exceptional $51,465 |
| Immigrants | Turkey | 100.0 /100 | #42 | Exceptional $51,368 |
| Immigrants | Lithuania | 100.0 /100 | #43 | Exceptional $51,361 |
| Immigrants | Europe | 100.0 /100 | #44 | Exceptional $50,950 |
| Immigrants | Spain | 100.0 /100 | #45 | Exceptional $50,933 |
| Immigrants | Latvia | 100.0 /100 | #46 | Exceptional $50,914 |
| Bulgarians | 100.0 /100 | #47 | Exceptional $50,906 |
| Immigrants | Serbia | 100.0 /100 | #48 | Exceptional $50,810 |
| New Zealanders | 100.0 /100 | #49 | Exceptional $50,575 |
| Immigrants | Sri Lanka | 100.0 /100 | #50 | Exceptional $50,555 |
| Immigrants | Netherlands | 100.0 /100 | #51 | Exceptional $50,458 |
| Immigrants | Croatia | 99.9 /100 | #52 | Exceptional $50,417 |
| Paraguayans | 99.9 /100 | #53 | Exceptional $50,385 |
| Immigrants | Belarus | 99.9 /100 | #54 | Exceptional $50,303 |
| Immigrants | Western Europe | 99.9 /100 | #55 | Exceptional $50,065 |
| Asians | 99.9 /100 | #56 | Exceptional $50,057 |
| South Africans | 99.9 /100 | #57 | Exceptional $50,044 |
| Immigrants | Malaysia | 99.9 /100 | #58 | Exceptional $49,983 |