Lithuanian vs Immigrants from Afghanistan Per Capita Income
COMPARE
Lithuanian
Immigrants from Afghanistan
Per Capita Income
Per Capita Income Comparison
Lithuanians
Immigrants from Afghanistan
$49,448
PER CAPITA INCOME
99.8/ 100
METRIC RATING
68th/ 347
METRIC RANK
$44,790
PER CAPITA INCOME
78.0/ 100
METRIC RATING
145th/ 347
METRIC RANK
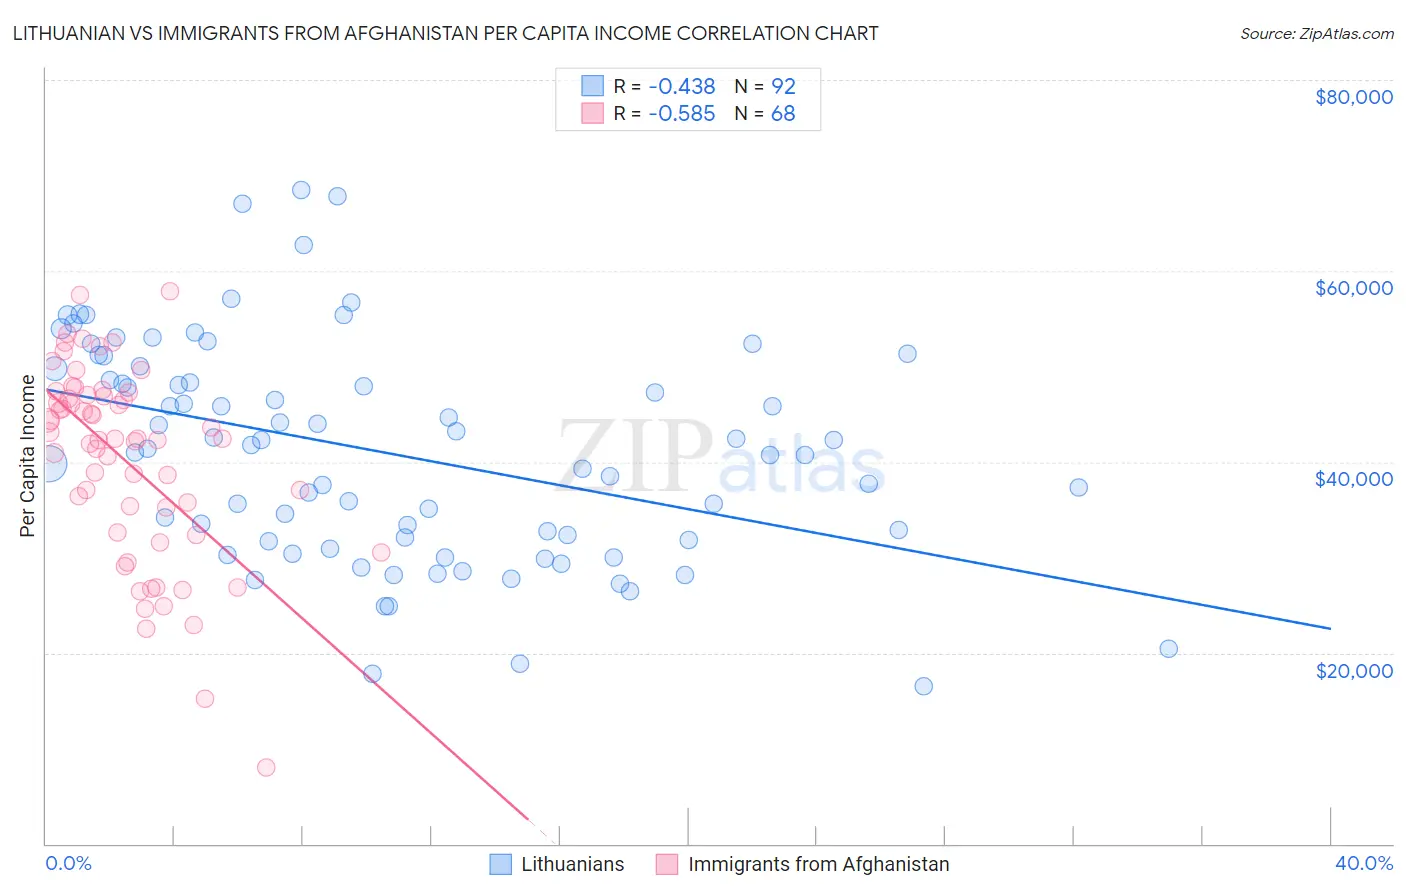
Lithuanian vs Immigrants from Afghanistan Per Capita Income Correlation Chart
The statistical analysis conducted on geographies consisting of 421,963,914 people shows a moderate negative correlation between the proportion of Lithuanians and per capita income in the United States with a correlation coefficient (R) of -0.438 and weighted average of $49,448. Similarly, the statistical analysis conducted on geographies consisting of 147,645,791 people shows a substantial negative correlation between the proportion of Immigrants from Afghanistan and per capita income in the United States with a correlation coefficient (R) of -0.585 and weighted average of $44,790, a difference of 10.4%.
Per Capita Income Correlation Summary
| Measurement | Lithuanian | Immigrants from Afghanistan |
| Minimum | $16,487 | $8,026 |
| Maximum | $68,542 | $57,850 |
| Range | $52,055 | $49,824 |
| Mean | $40,931 | $40,206 |
| Median | $41,220 | $42,427 |
| Interquartile 25% (IQ1) | $31,717 | $33,957 |
| Interquartile 75% (IQ3) | $49,156 | $46,949 |
| Interquartile Range (IQR) | $17,439 | $12,992 |
| Standard Deviation (Sample) | $11,469 | $10,126 |
| Standard Deviation (Population) | $11,406 | $10,052 |
Similar Demographics by Per Capita Income
Demographics Similar to Lithuanians by Per Capita Income
In terms of per capita income, the demographic groups most similar to Lithuanians are Immigrants from Romania ($49,463, a difference of 0.030%), Immigrants from Bulgaria ($49,482, a difference of 0.070%), Immigrants from Canada ($49,412, a difference of 0.070%), Bolivian ($49,526, a difference of 0.16%), and Immigrants from Eastern Europe ($49,316, a difference of 0.27%).
| Demographics | Rating | Rank | Per Capita Income |
| Argentineans | 99.9 /100 | #61 | Exceptional $49,862 |
| Immigrants | Asia | 99.9 /100 | #62 | Exceptional $49,741 |
| Maltese | 99.9 /100 | #63 | Exceptional $49,640 |
| Immigrants | Argentina | 99.9 /100 | #64 | Exceptional $49,627 |
| Bolivians | 99.9 /100 | #65 | Exceptional $49,526 |
| Immigrants | Bulgaria | 99.9 /100 | #66 | Exceptional $49,482 |
| Immigrants | Romania | 99.9 /100 | #67 | Exceptional $49,463 |
| Lithuanians | 99.8 /100 | #68 | Exceptional $49,448 |
| Immigrants | Canada | 99.8 /100 | #69 | Exceptional $49,412 |
| Immigrants | Eastern Europe | 99.8 /100 | #70 | Exceptional $49,316 |
| Greeks | 99.8 /100 | #71 | Exceptional $49,309 |
| Immigrants | Hungary | 99.8 /100 | #72 | Exceptional $49,303 |
| Immigrants | North America | 99.8 /100 | #73 | Exceptional $49,302 |
| Mongolians | 99.8 /100 | #74 | Exceptional $49,173 |
| Immigrants | Bolivia | 99.7 /100 | #75 | Exceptional $48,970 |
Demographics Similar to Immigrants from Afghanistan by Per Capita Income
In terms of per capita income, the demographic groups most similar to Immigrants from Afghanistan are Irish ($44,679, a difference of 0.25%), Icelander ($44,987, a difference of 0.44%), Czech ($44,595, a difference of 0.44%), Immigrants from Armenia ($44,552, a difference of 0.53%), and Immigrants from Uganda ($45,043, a difference of 0.56%).
| Demographics | Rating | Rank | Per Capita Income |
| Assyrians/Chaldeans/Syriacs | 84.8 /100 | #138 | Excellent $45,195 |
| Basques | 83.2 /100 | #139 | Excellent $45,086 |
| Immigrants | Jordan | 82.9 /100 | #140 | Excellent $45,066 |
| Slavs | 82.6 /100 | #141 | Excellent $45,049 |
| Ugandans | 82.6 /100 | #142 | Excellent $45,047 |
| Immigrants | Uganda | 82.5 /100 | #143 | Excellent $45,043 |
| Icelanders | 81.6 /100 | #144 | Excellent $44,987 |
| Immigrants | Afghanistan | 78.0 /100 | #145 | Good $44,790 |
| Irish | 75.8 /100 | #146 | Good $44,679 |
| Czechs | 74.1 /100 | #147 | Good $44,595 |
| Immigrants | Armenia | 73.1 /100 | #148 | Good $44,552 |
| Koreans | 72.5 /100 | #149 | Good $44,522 |
| Immigrants | Eritrea | 72.1 /100 | #150 | Good $44,509 |
| Norwegians | 71.5 /100 | #151 | Good $44,480 |
| Peruvians | 71.5 /100 | #152 | Good $44,479 |