Immigrants from Canada vs Thai Median Earnings
COMPARE
Immigrants from Canada
Thai
Median Earnings
Median Earnings Comparison
Immigrants from Canada
Thais
$50,192
MEDIAN EARNINGS
99.5/ 100
METRIC RATING
86th/ 347
METRIC RANK
$59,237
MEDIAN EARNINGS
100.0/ 100
METRIC RATING
5th/ 347
METRIC RANK
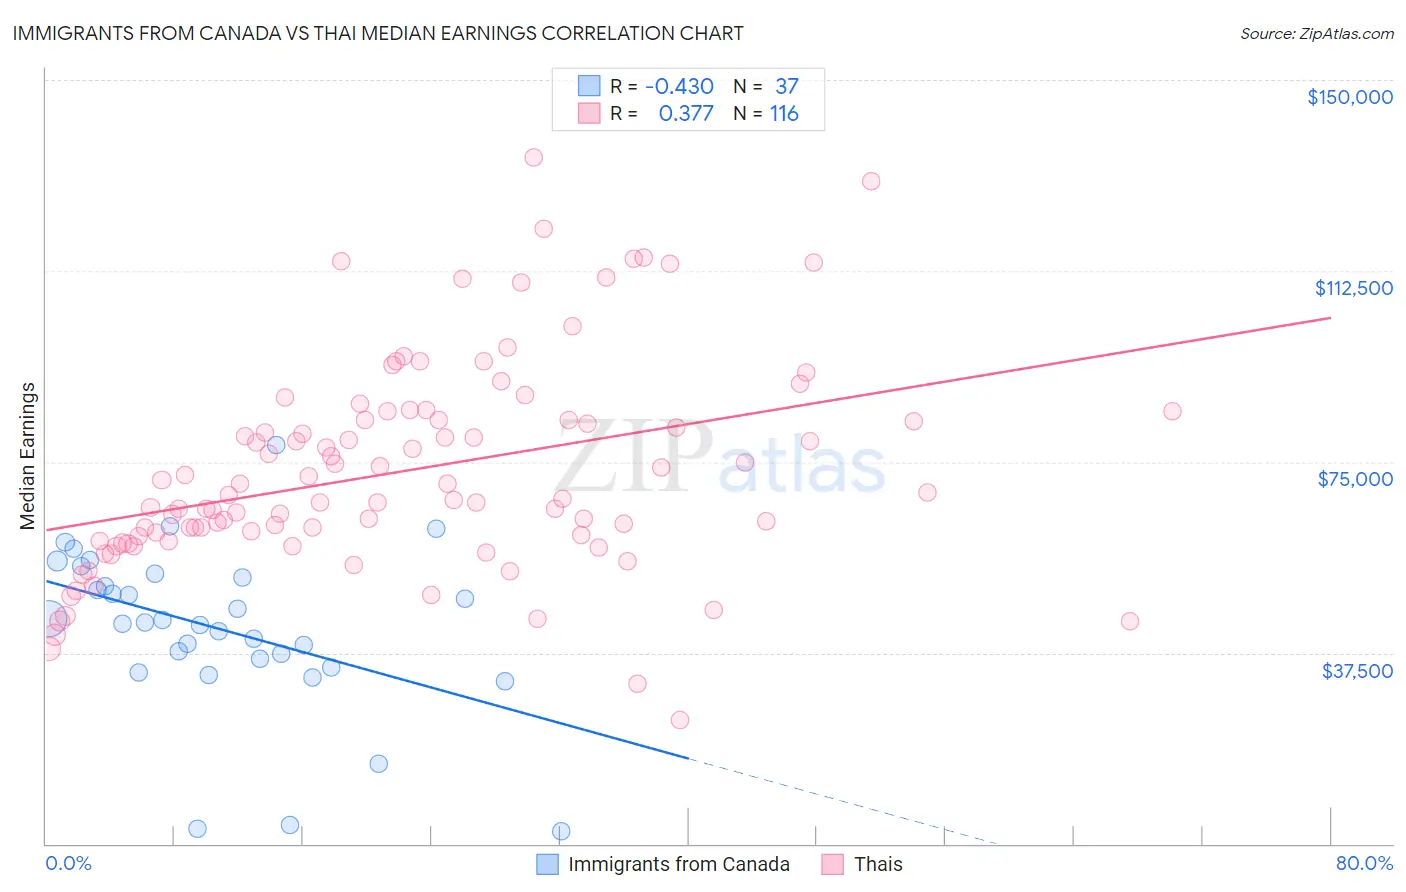
Immigrants from Canada vs Thai Median Earnings Correlation Chart
The statistical analysis conducted on geographies consisting of 459,326,577 people shows a moderate negative correlation between the proportion of Immigrants from Canada and median earnings in the United States with a correlation coefficient (R) of -0.430 and weighted average of $50,192. Similarly, the statistical analysis conducted on geographies consisting of 475,851,474 people shows a mild positive correlation between the proportion of Thais and median earnings in the United States with a correlation coefficient (R) of 0.377 and weighted average of $59,237, a difference of 18.0%.
Median Earnings Correlation Summary
| Measurement | Immigrants from Canada | Thai |
| Minimum | $2,499 | $24,353 |
| Maximum | $78,310 | $134,793 |
| Range | $75,811 | $110,440 |
| Mean | $42,254 | $73,089 |
| Median | $43,536 | $68,147 |
| Interquartile 25% (IQ1) | $35,442 | $59,963 |
| Interquartile 75% (IQ3) | $52,692 | $83,196 |
| Interquartile Range (IQR) | $17,250 | $23,232 |
| Standard Deviation (Sample) | $16,214 | $20,568 |
| Standard Deviation (Population) | $15,993 | $20,479 |
Similar Demographics by Median Earnings
Demographics Similar to Immigrants from Canada by Median Earnings
In terms of median earnings, the demographic groups most similar to Immigrants from Canada are Immigrants from Hungary ($50,227, a difference of 0.070%), Immigrants from Kazakhstan ($50,225, a difference of 0.070%), Immigrants from Uzbekistan ($50,151, a difference of 0.080%), Romanian ($50,244, a difference of 0.10%), and Albanian ($50,116, a difference of 0.15%).
| Demographics | Rating | Rank | Median Earnings |
| Laotians | 99.6 /100 | #79 | Exceptional $50,343 |
| Ukrainians | 99.6 /100 | #80 | Exceptional $50,320 |
| Immigrants | Southern Europe | 99.6 /100 | #81 | Exceptional $50,280 |
| Immigrants | Moldova | 99.5 /100 | #82 | Exceptional $50,274 |
| Romanians | 99.5 /100 | #83 | Exceptional $50,244 |
| Immigrants | Hungary | 99.5 /100 | #84 | Exceptional $50,227 |
| Immigrants | Kazakhstan | 99.5 /100 | #85 | Exceptional $50,225 |
| Immigrants | Canada | 99.5 /100 | #86 | Exceptional $50,192 |
| Immigrants | Uzbekistan | 99.5 /100 | #87 | Exceptional $50,151 |
| Albanians | 99.4 /100 | #88 | Exceptional $50,116 |
| Immigrants | North America | 99.4 /100 | #89 | Exceptional $50,108 |
| Italians | 99.3 /100 | #90 | Exceptional $49,915 |
| Macedonians | 99.2 /100 | #91 | Exceptional $49,893 |
| Immigrants | Argentina | 99.2 /100 | #92 | Exceptional $49,841 |
| Armenians | 99.1 /100 | #93 | Exceptional $49,804 |
Demographics Similar to Thais by Median Earnings
In terms of median earnings, the demographic groups most similar to Thais are Immigrants from Hong Kong ($59,433, a difference of 0.33%), Immigrants from Singapore ($59,038, a difference of 0.34%), Iranian ($58,474, a difference of 1.3%), Immigrants from India ($60,648, a difference of 2.4%), and Immigrants from Iran ($57,612, a difference of 2.8%).
| Demographics | Rating | Rank | Median Earnings |
| Filipinos | 100.0 /100 | #1 | Exceptional $61,197 |
| Immigrants | Taiwan | 100.0 /100 | #2 | Exceptional $61,151 |
| Immigrants | India | 100.0 /100 | #3 | Exceptional $60,648 |
| Immigrants | Hong Kong | 100.0 /100 | #4 | Exceptional $59,433 |
| Thais | 100.0 /100 | #5 | Exceptional $59,237 |
| Immigrants | Singapore | 100.0 /100 | #6 | Exceptional $59,038 |
| Iranians | 100.0 /100 | #7 | Exceptional $58,474 |
| Immigrants | Iran | 100.0 /100 | #8 | Exceptional $57,612 |
| Okinawans | 100.0 /100 | #9 | Exceptional $57,550 |
| Immigrants | South Central Asia | 100.0 /100 | #10 | Exceptional $57,114 |
| Immigrants | Israel | 100.0 /100 | #11 | Exceptional $57,034 |
| Immigrants | Ireland | 100.0 /100 | #12 | Exceptional $56,854 |
| Immigrants | China | 100.0 /100 | #13 | Exceptional $56,638 |
| Immigrants | Australia | 100.0 /100 | #14 | Exceptional $56,305 |
| Indians (Asian) | 100.0 /100 | #15 | Exceptional $56,253 |