Polish vs Thai Master's Degree
COMPARE
Polish
Thai
Master's Degree
Master's Degree Comparison
Poles
Thais
15.7%
MASTER'S DEGREE
85.0/ 100
METRIC RATING
141st/ 347
METRIC RANK
21.7%
MASTER'S DEGREE
100.0/ 100
METRIC RATING
9th/ 347
METRIC RANK
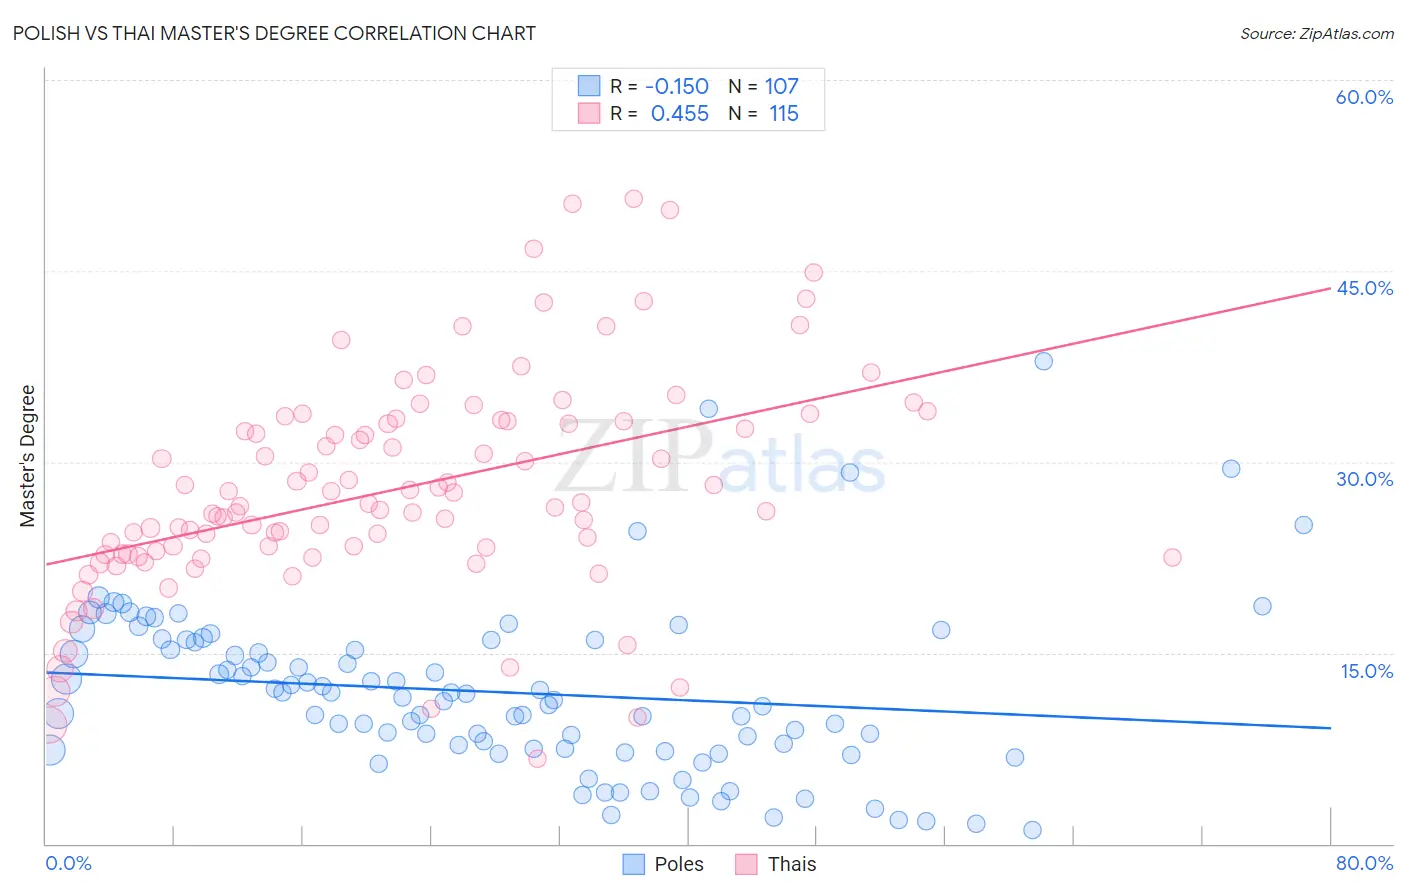
Polish vs Thai Master's Degree Correlation Chart
The statistical analysis conducted on geographies consisting of 559,882,025 people shows a poor negative correlation between the proportion of Poles and percentage of population with at least master's degree education in the United States with a correlation coefficient (R) of -0.150 and weighted average of 15.7%. Similarly, the statistical analysis conducted on geographies consisting of 475,625,937 people shows a moderate positive correlation between the proportion of Thais and percentage of population with at least master's degree education in the United States with a correlation coefficient (R) of 0.455 and weighted average of 21.7%, a difference of 37.9%.
Master's Degree Correlation Summary
| Measurement | Polish | Thai |
| Minimum | 1.0% | 6.7% |
| Maximum | 37.9% | 50.7% |
| Range | 36.9% | 44.0% |
| Mean | 11.9% | 27.8% |
| Median | 11.5% | 26.5% |
| Interquartile 25% (IQ1) | 7.4% | 22.7% |
| Interquartile 75% (IQ3) | 16.0% | 33.2% |
| Interquartile Range (IQR) | 8.5% | 10.4% |
| Standard Deviation (Sample) | 6.6% | 8.5% |
| Standard Deviation (Population) | 6.6% | 8.5% |
Similar Demographics by Master's Degree
Demographics Similar to Poles by Master's Degree
In terms of master's degree, the demographic groups most similar to Poles are Vietnamese (15.8%, a difference of 0.12%), Immigrants from Germany (15.8%, a difference of 0.21%), Immigrants from Africa (15.7%, a difference of 0.23%), Pakistani (15.8%, a difference of 0.27%), and Immigrants from Venezuela (15.7%, a difference of 0.32%).
| Demographics | Rating | Rank | Master's Degree |
| Venezuelans | 88.4 /100 | #134 | Excellent 15.9% |
| South American Indians | 88.4 /100 | #135 | Excellent 15.9% |
| Assyrians/Chaldeans/Syriacs | 86.8 /100 | #136 | Excellent 15.8% |
| Europeans | 86.4 /100 | #137 | Excellent 15.8% |
| Pakistanis | 86.1 /100 | #138 | Excellent 15.8% |
| Immigrants | Germany | 85.9 /100 | #139 | Excellent 15.8% |
| Vietnamese | 85.5 /100 | #140 | Excellent 15.8% |
| Poles | 85.0 /100 | #141 | Excellent 15.7% |
| Immigrants | Africa | 84.0 /100 | #142 | Excellent 15.7% |
| Immigrants | Venezuela | 83.6 /100 | #143 | Excellent 15.7% |
| Canadians | 83.3 /100 | #144 | Excellent 15.7% |
| South Americans | 81.3 /100 | #145 | Excellent 15.6% |
| Immigrants | Afghanistan | 79.4 /100 | #146 | Good 15.6% |
| Hungarians | 79.1 /100 | #147 | Good 15.6% |
| Immigrants | Senegal | 78.2 /100 | #148 | Good 15.5% |
Demographics Similar to Thais by Master's Degree
In terms of master's degree, the demographic groups most similar to Thais are Cypriot (21.8%, a difference of 0.34%), Immigrants from Iran (21.6%, a difference of 0.41%), Immigrants from China (21.2%, a difference of 2.5%), Iranian (22.3%, a difference of 2.5%), and Immigrants from India (22.3%, a difference of 2.8%).
| Demographics | Rating | Rank | Master's Degree |
| Filipinos | 100.0 /100 | #2 | Exceptional 23.4% |
| Immigrants | Israel | 100.0 /100 | #3 | Exceptional 22.6% |
| Okinawans | 100.0 /100 | #4 | Exceptional 22.6% |
| Immigrants | Taiwan | 100.0 /100 | #5 | Exceptional 22.5% |
| Immigrants | India | 100.0 /100 | #6 | Exceptional 22.3% |
| Iranians | 100.0 /100 | #7 | Exceptional 22.3% |
| Cypriots | 100.0 /100 | #8 | Exceptional 21.8% |
| Thais | 100.0 /100 | #9 | Exceptional 21.7% |
| Immigrants | Iran | 100.0 /100 | #10 | Exceptional 21.6% |
| Immigrants | China | 100.0 /100 | #11 | Exceptional 21.2% |
| Eastern Europeans | 100.0 /100 | #12 | Exceptional 21.1% |
| Immigrants | Australia | 100.0 /100 | #13 | Exceptional 20.9% |
| Immigrants | Switzerland | 100.0 /100 | #14 | Exceptional 20.9% |
| Immigrants | Eastern Asia | 100.0 /100 | #15 | Exceptional 20.8% |
| Immigrants | Belgium | 100.0 /100 | #16 | Exceptional 20.8% |