Polish vs Palestinian Median Male Earnings
COMPARE
Polish
Palestinian
Median Male Earnings
Median Male Earnings Comparison
Poles
Palestinians
$58,139
MEDIAN MALE EARNINGS
97.3/ 100
METRIC RATING
103rd/ 347
METRIC RANK
$57,778
MEDIAN MALE EARNINGS
96.2/ 100
METRIC RATING
110th/ 347
METRIC RANK
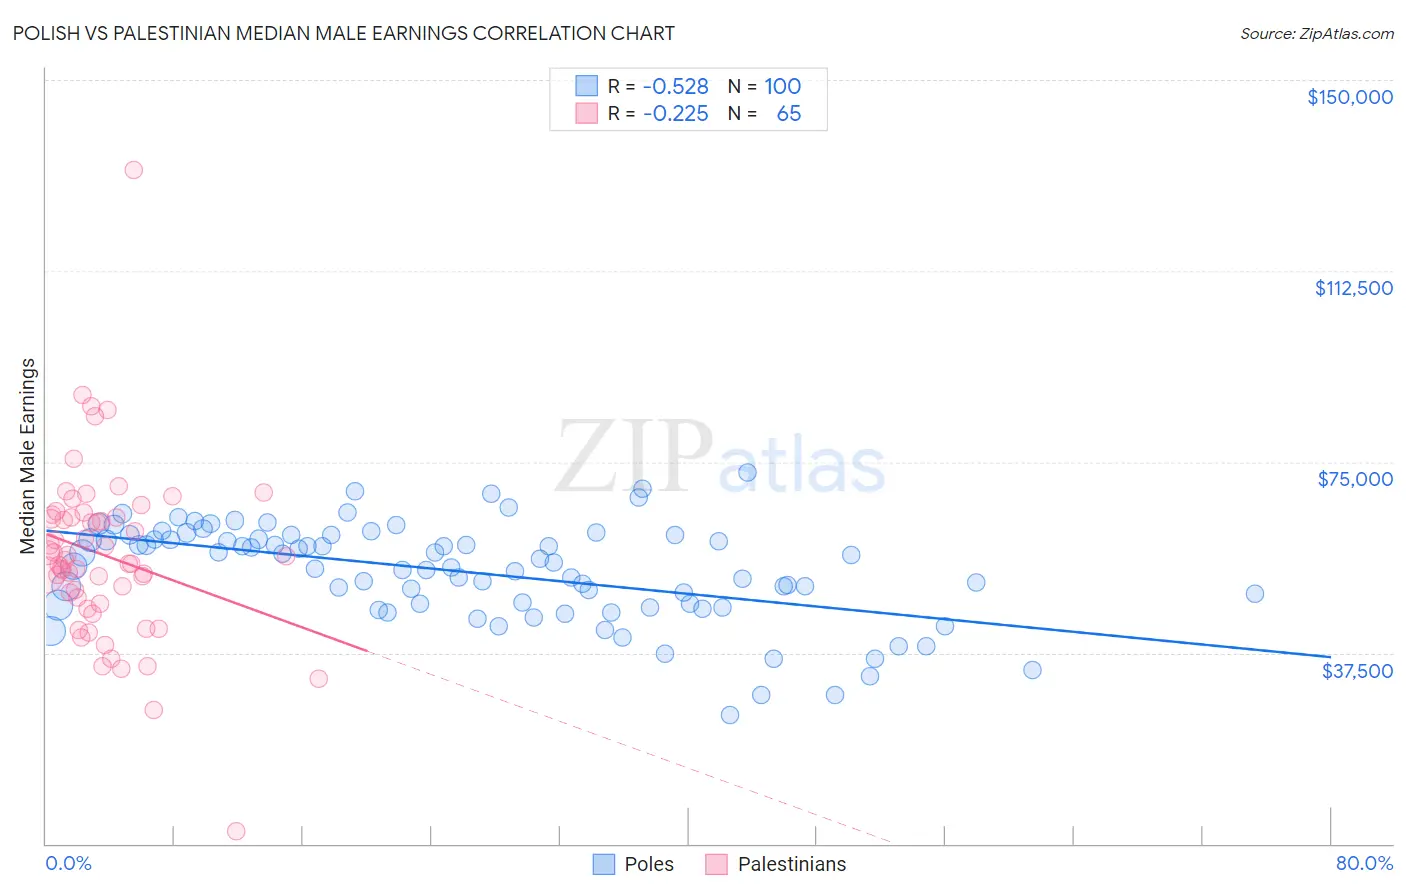
Polish vs Palestinian Median Male Earnings Correlation Chart
The statistical analysis conducted on geographies consisting of 559,585,611 people shows a substantial negative correlation between the proportion of Poles and median male earnings in the United States with a correlation coefficient (R) of -0.528 and weighted average of $58,139. Similarly, the statistical analysis conducted on geographies consisting of 216,446,429 people shows a weak negative correlation between the proportion of Palestinians and median male earnings in the United States with a correlation coefficient (R) of -0.225 and weighted average of $57,778, a difference of 0.63%.
Median Male Earnings Correlation Summary
| Measurement | Polish | Palestinian |
| Minimum | $25,204 | $2,499 |
| Maximum | $72,933 | $132,344 |
| Range | $47,729 | $129,845 |
| Mean | $53,382 | $56,632 |
| Median | $54,879 | $55,657 |
| Interquartile 25% (IQ1) | $46,953 | $47,716 |
| Interquartile 75% (IQ3) | $60,187 | $64,385 |
| Interquartile Range (IQR) | $13,234 | $16,670 |
| Standard Deviation (Sample) | $9,652 | $17,442 |
| Standard Deviation (Population) | $9,604 | $17,308 |
Demographics Similar to Poles and Palestinians by Median Male Earnings
In terms of median male earnings, the demographic groups most similar to Poles are Armenian ($58,134, a difference of 0.010%), Immigrants from Western Asia ($58,131, a difference of 0.020%), Syrian ($58,187, a difference of 0.080%), Immigrants from Northern Africa ($58,008, a difference of 0.23%), and Serbian ($57,975, a difference of 0.28%). Similarly, the demographic groups most similar to Palestinians are British ($57,890, a difference of 0.19%), European ($57,637, a difference of 0.25%), Immigrants from Uzbekistan ($57,941, a difference of 0.28%), Serbian ($57,975, a difference of 0.34%), and Immigrants from Afghanistan ($57,582, a difference of 0.34%).
| Demographics | Rating | Rank | Median Male Earnings |
| Albanians | 98.4 /100 | #96 | Exceptional $58,680 |
| Northern Europeans | 98.2 /100 | #97 | Exceptional $58,588 |
| Jordanians | 98.1 /100 | #98 | Exceptional $58,500 |
| Immigrants | Poland | 98.0 /100 | #99 | Exceptional $58,452 |
| Assyrians/Chaldeans/Syriacs | 97.9 /100 | #100 | Exceptional $58,437 |
| Immigrants | Brazil | 97.7 /100 | #101 | Exceptional $58,324 |
| Syrians | 97.4 /100 | #102 | Exceptional $58,187 |
| Poles | 97.3 /100 | #103 | Exceptional $58,139 |
| Armenians | 97.3 /100 | #104 | Exceptional $58,134 |
| Immigrants | Western Asia | 97.3 /100 | #105 | Exceptional $58,131 |
| Immigrants | Northern Africa | 96.9 /100 | #106 | Exceptional $58,008 |
| Serbians | 96.8 /100 | #107 | Exceptional $57,975 |
| Immigrants | Uzbekistan | 96.7 /100 | #108 | Exceptional $57,941 |
| British | 96.5 /100 | #109 | Exceptional $57,890 |
| Palestinians | 96.2 /100 | #110 | Exceptional $57,778 |
| Europeans | 95.6 /100 | #111 | Exceptional $57,637 |
| Immigrants | Afghanistan | 95.4 /100 | #112 | Exceptional $57,582 |
| Carpatho Rusyns | 95.3 /100 | #113 | Exceptional $57,572 |
| Immigrants | Kuwait | 95.3 /100 | #114 | Exceptional $57,562 |
| Swedes | 94.8 /100 | #115 | Exceptional $57,445 |
| Lebanese | 94.6 /100 | #116 | Exceptional $57,409 |